Any online store has a to-do list of long-overdue page-level fixes: the copy nobody’s rewritten, the check-out untouched since launch, and the product page that pushes the “Buy” button off the screen. You have reasonable ideas, and no way to tell which one is costing you money.
Ecommerce conversion rate optimisation (CRO) rewards working through fixes in the right order. Diagnosing and ranking CRO fixes works much the same wherever you sell. What changes in the UK is the detail. Rules from the Digital Markets, Competition and Consumers Act 2024 (DMCC) and the Competition & Markets Authority (CMA) govern how you display pricing, delivery, and fees. UK shoppers, meanwhile, have their own habits around wallets, delivery cut-offs, and instalment payments.
This guide shows you how to use your store’s conversion rate, average order value (AOV), and revenue per session (RPS) to prioritise your CRO fixes by estimated revenue impact. It also shows you where the next round of conversion gains comes from once the page-level work is done.
Compare your store against relevant benchmarks
Before you change anything on your store, check whether you have a conversion rate problem or a comparison problem. Some benchmarks divide orders by visitors, some by sessions, and the two produce different numbers from identical behaviour.
A visitor-based rate counts unique people. A session-based rate counts visits. If one visitor opens 5 sessions in a week and buys once, that single buyer shows up as a 100% conversion rate by visitor and a 20% rate by session. Sessions tend to be the more useful unit for CRO work, since that’s how the benchmarks in this guide report and how you’ll price your fixes later on.
Hypothetically speaking, if your store converts at 1.8% of sessions and the benchmark you’re reading is a visitor-based 3%, that doesn’t put you 1.2 points behind the market. Those figures aren’t counting the same thing, so the gap between a session-based benchmark and a visitor-based one can mislead you.
Then you have an extra nuance around where the data comes from. Global metrics average out markets with different delivery expectations, payment habits, and return rates, so they tell you little about how UK shoppers behave. IRP Commerce’s ecommerce market benchmarks, however, report on Great Britain, Northern Ireland, and Ireland, and count by session, AOV, and RPS.
According to IRP Commerce, which calculates conversion as transactions divided by sessions, overall session conversion was 2.03% in June 2026, up from 1.85% in June 2025. If you’re meaningfully below that, say 1.4% or under, you have a leak to find. If you’re within about 0.2 points of that 2.03%, your conversion rate isn’t holding revenue back. What a session earns you depends on how many sessions buy and what each order is worth. So when your conversion rate is at market, check your AOV instead.
Ecommerce benchmarks tell you whether to look, not which part of your store to look at.
However closely you read a store-wide, blended conversion rate, it won’t tell you where to look, either. Split it by device and by traffic source to find out. Your store conversion rate might sit at 2% overall while running 3.4% on desktop and 1.1% on mobile. Or it might be converting returning email traffic at 4x the rate of returning social traffic. The blended number hides both. The split tells you which device or channel is dragging the average down.
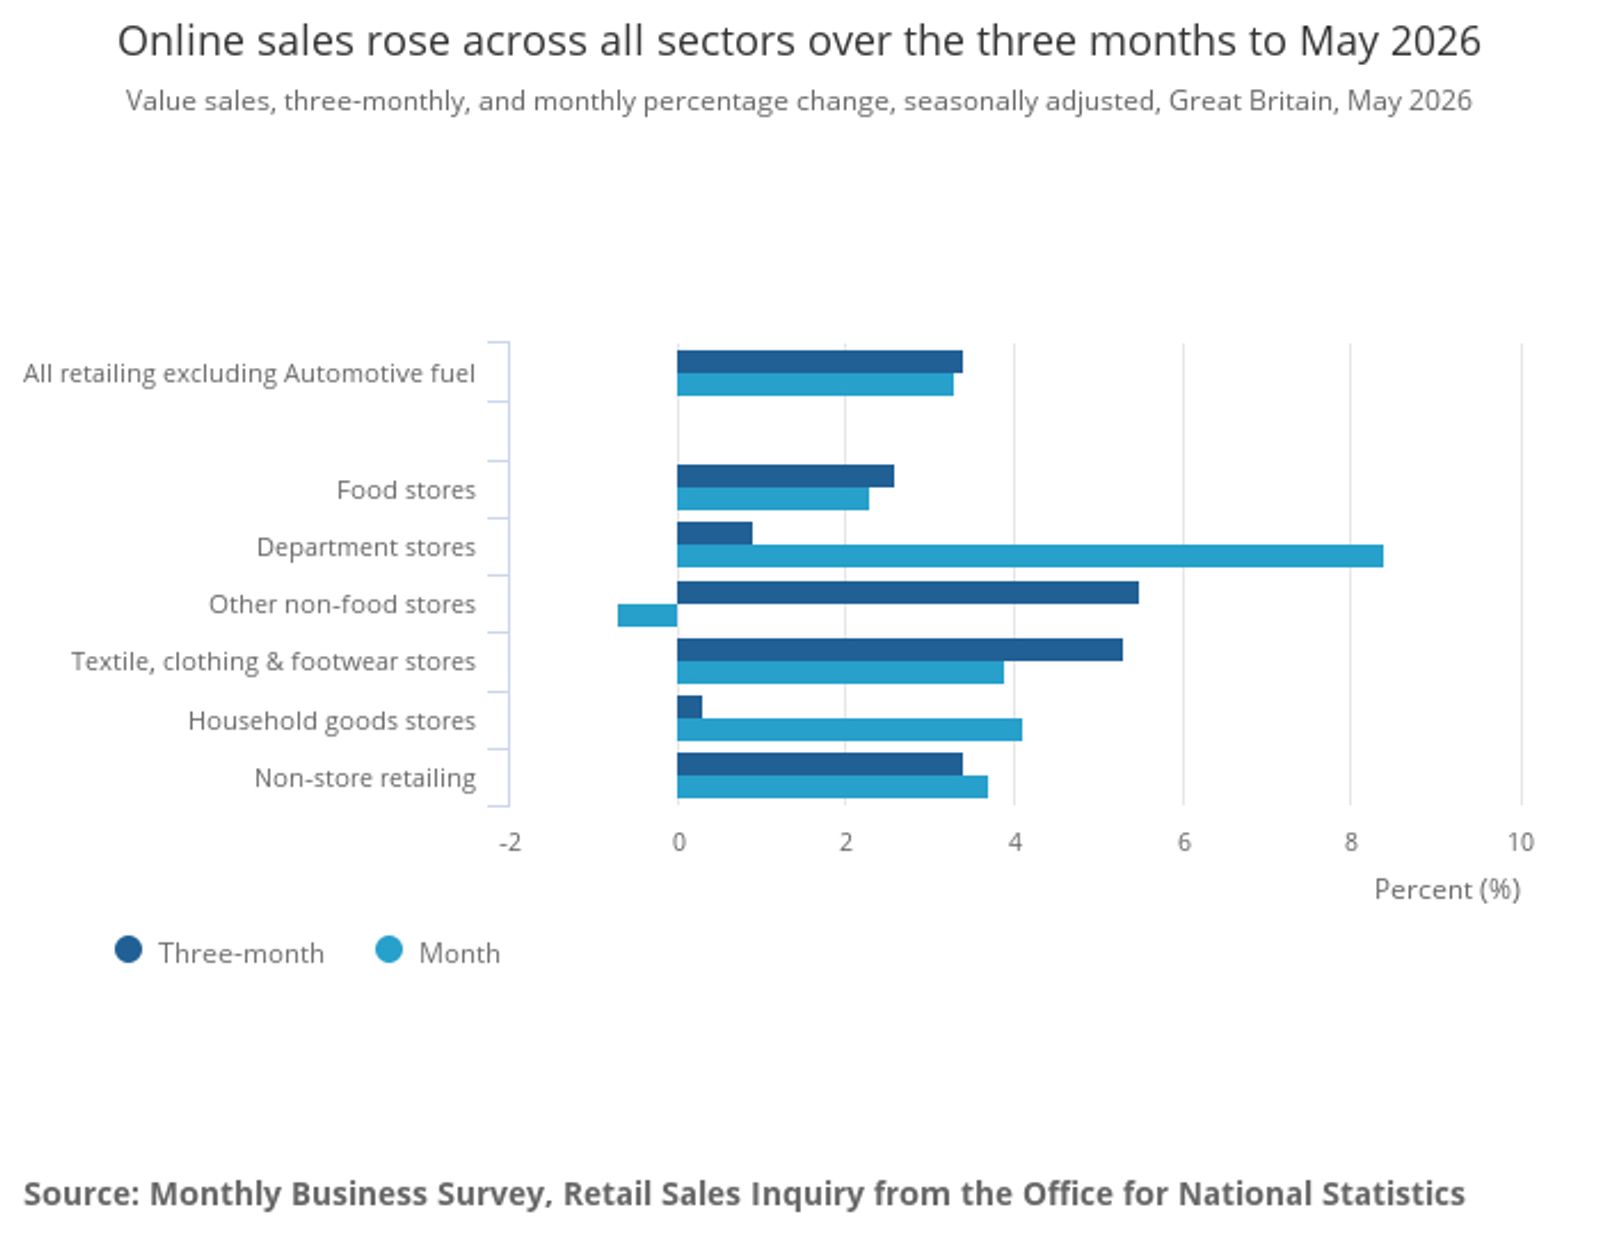
When sales flatten, the reflex is to buy more traffic, and that would make sense if demand itself had shrunk. But that isn’t what the data shows. Online spending in Great Britain rose 9.8% between March and May 2026 compared with the same months in 2025, according to the Monthly Business Survey, Retail Sales Inquiry from the Office for National Statistics (ONS). The full series is available in the ONS Retail Sales Index internet sales datasets.
Online is taking a bigger share of what people spend. Pushing paid traffic through a leaking funnel raises your cost per order without fixing anything.
The rest of this diagnosis runs on what share of sessions buy, what each order is worth, and what a single session earns you. Define these 3 metrics the same way each time you check your funnel:
- Conversion rate: Divide orders by sessions over the same period. For example: 50 orders / 2,500 sessions = 2% conversion rate.
- Average order value: Divide revenue by orders. For example: £7,500 in revenue / 50 orders = £150 AOV.
- Revenue per session: Divide revenue by sessions. For example: £7,500 in revenue / 2,500 sessions = £3.00 RPS.
Unlike conversion rate and AOV, RPS isn’t independent. Your conversion rate multiplied by your AOV lands you on RPS (e.g., 2% × £150 = £3.00), the same figure you get dividing revenue by sessions. Discounting your way to a 10% better conversion rate could make your AOV drop, leaving RPS barely moved. Cut your lowest-converting paid channel and conversion looks better on less traffic, while RPS tells you whether your store actually earns more per session.
RPS also puts a price on a web session. IRP Commerce recorded RPS in Great Britain, Northern Ireland, and Ireland at £1.89 in June 2026. At that rate, an online store with 50,000 web sessions a month, for instance, makes £94,500. If a CRO fix lifts RPS by £0.10 with sessions and marketing spend unchanged, that’s another £5,000 a month. Once you’re familiar with your RPS, you can estimate the value of a proposed CRO fix and weigh it against the effort of implementation.
Trace the conversion leaks draining your funnel
How you prioritise the list of CRO fixes counts for more than how long it is. A 10% improvement to the delivery options on your store’s check-out page, where people drop out with a full cart, likely beats a 40% improvement to the size guide on a product page barely anyone opens.
Go through your funnel and track how many sessions reach each step of the journey. Your web analytics holds the session and page counts. And your ecommerce CRM automatically records the customer events (viewed product, added to cart, started check-out, placed order) against individual profiles, so you can filter for everyone who reached one funnel step and not the next.
Together, the web analytics and CRM give you a full picture of ecommerce analytics you can use to act on CRO changes, showing you how many people reached each step of the funnel, and which customer profiles abandoned the process. Stores lose people at each funnel step, so what you’re after is the biggest drop relative to what that step should hold. Take the point where you lose most people, multiply the sessions you’d recover by your RPS, and you’ve priced the leak.
As an example, here’s a calculation laid out for a fictional store with 100,000 sessions a month.
Each row in the table below represents a funnel step. The drop-off is the share of sessions that abandon different stages of the buyer journey, and the recovery rate column is the share of those lost web sessions you'd expect to win back with your set of CRO fixes. The last column multiplies the recovery assumption by your RPS to show what those fixes could be worth.
Funnel step | Sessions reaching it | Drop-off % | Recovery assumption | × your RPS | Value at £1.89 RPS |
Landing page | 100,000 | 45% (45,000 lost) | 0.25% (113) | £1.89 | £214 |
Product pages | 55,000 | 84% (46,200 lost) | 0.5% (231) | £1.89 | £437 |
Add to cart | 8,800 | 44% (3,872 lost) | 3% (116) | £1.89 | £220 |
Check-out started | 4,928 | 58.8 % (2,898 lost) | 12% (348) | £1.89 | £657 |
Order placed | 2,030 | N/A | N/A | N/A | N/A |
Note: the table contains figures that start at 100,000 sessions and end at 2,030 orders, matching IRP Commerce’s 2.03% conversion rate. Treat the funnel steps in between, along with the drop-off and recovery rates, as illustrative. The value column uses IRP’s £1.89 RPS, too.
Set recovery assumptions low at the top of your funnel, where lost sessions might be from people who weren’t going to buy from your brand, and higher at check-out, where shoppers already chose the product, entered details to process the order, and only need a nudge to finish. Then replace each estimated rate with what your ecommerce tests recovered post-iteration.
While the drop-off at the product page might seem high, the monetary loss is lower, because those shoppers aren’t far enough down the funnel to be likely buyers. The drop-off at check-out is worth more on a fraction of the volume, because those shoppers had already decided to buy.
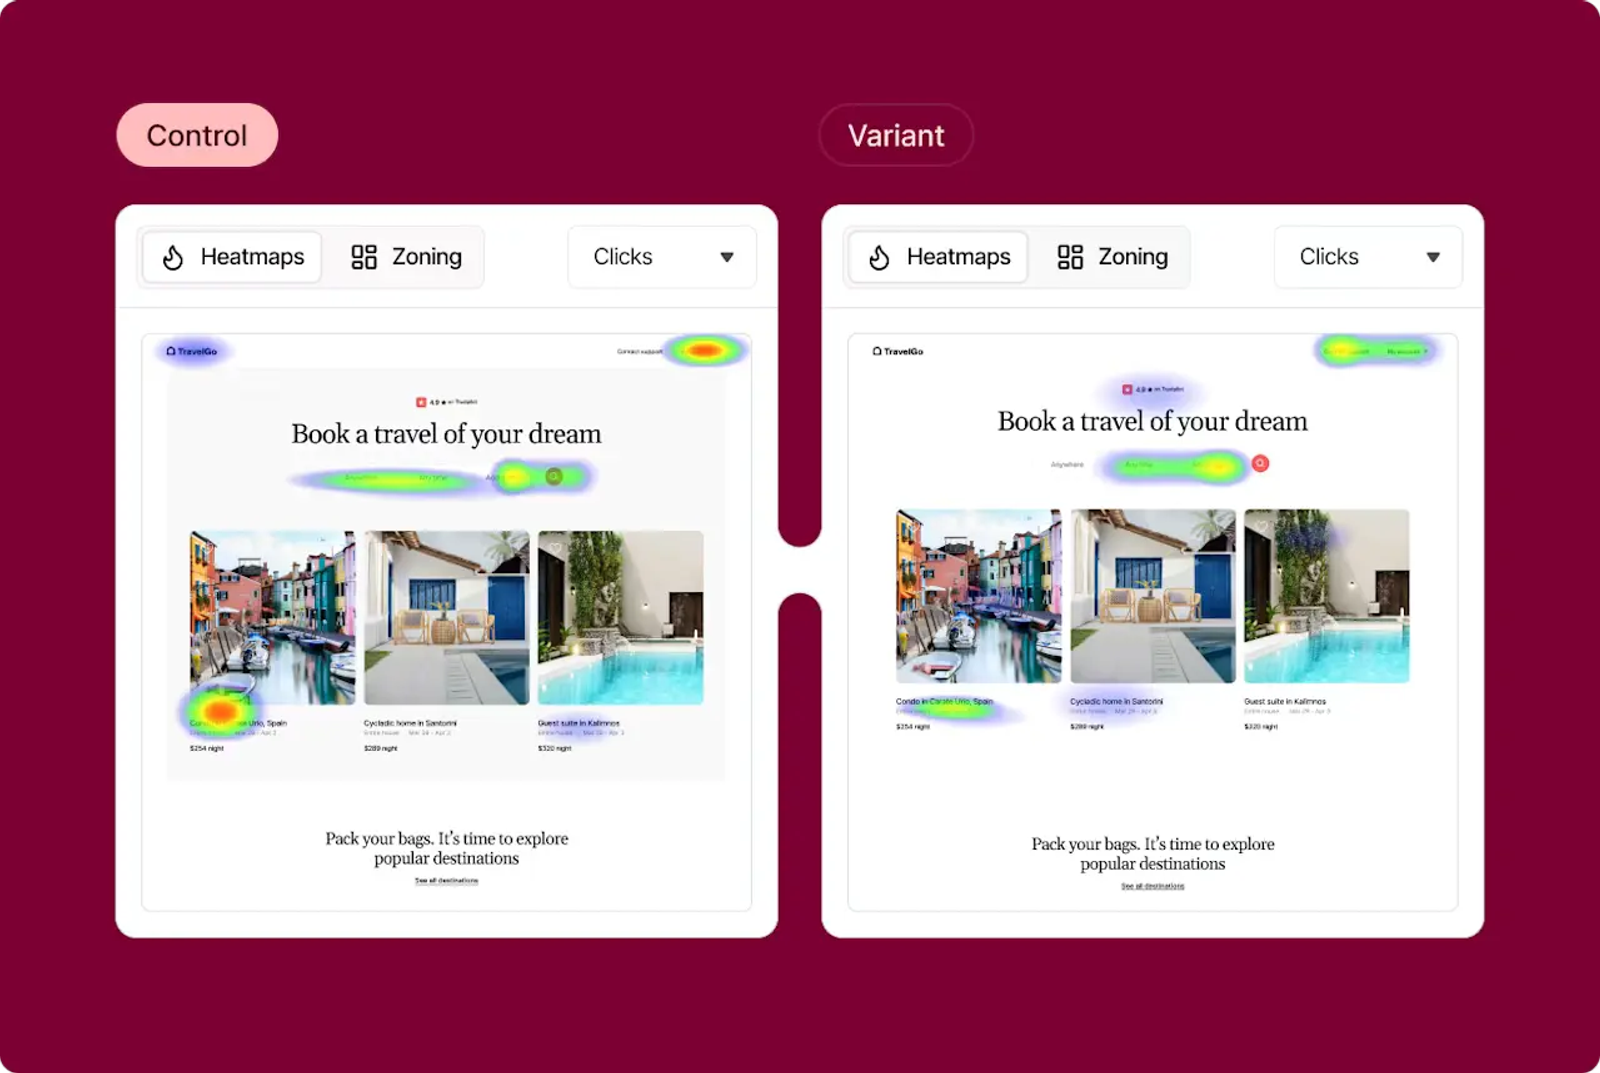
The step that’s underperforming still needs a hypothesis for why. Heatmap and session-recording software like Contentsquare can show you the on-page friction points, such as people tapping something that isn’t a link, missing a call to action (CTA) buried under 3 blocks of copy, or leaving a product page after looking for a delivery cost that isn’t there.
Contentsquare’s tap heatmap makes that visible, and let you set a control against a variant to see where taps move after a change. Warm colours mark where visitors tapped most, cool colours least.
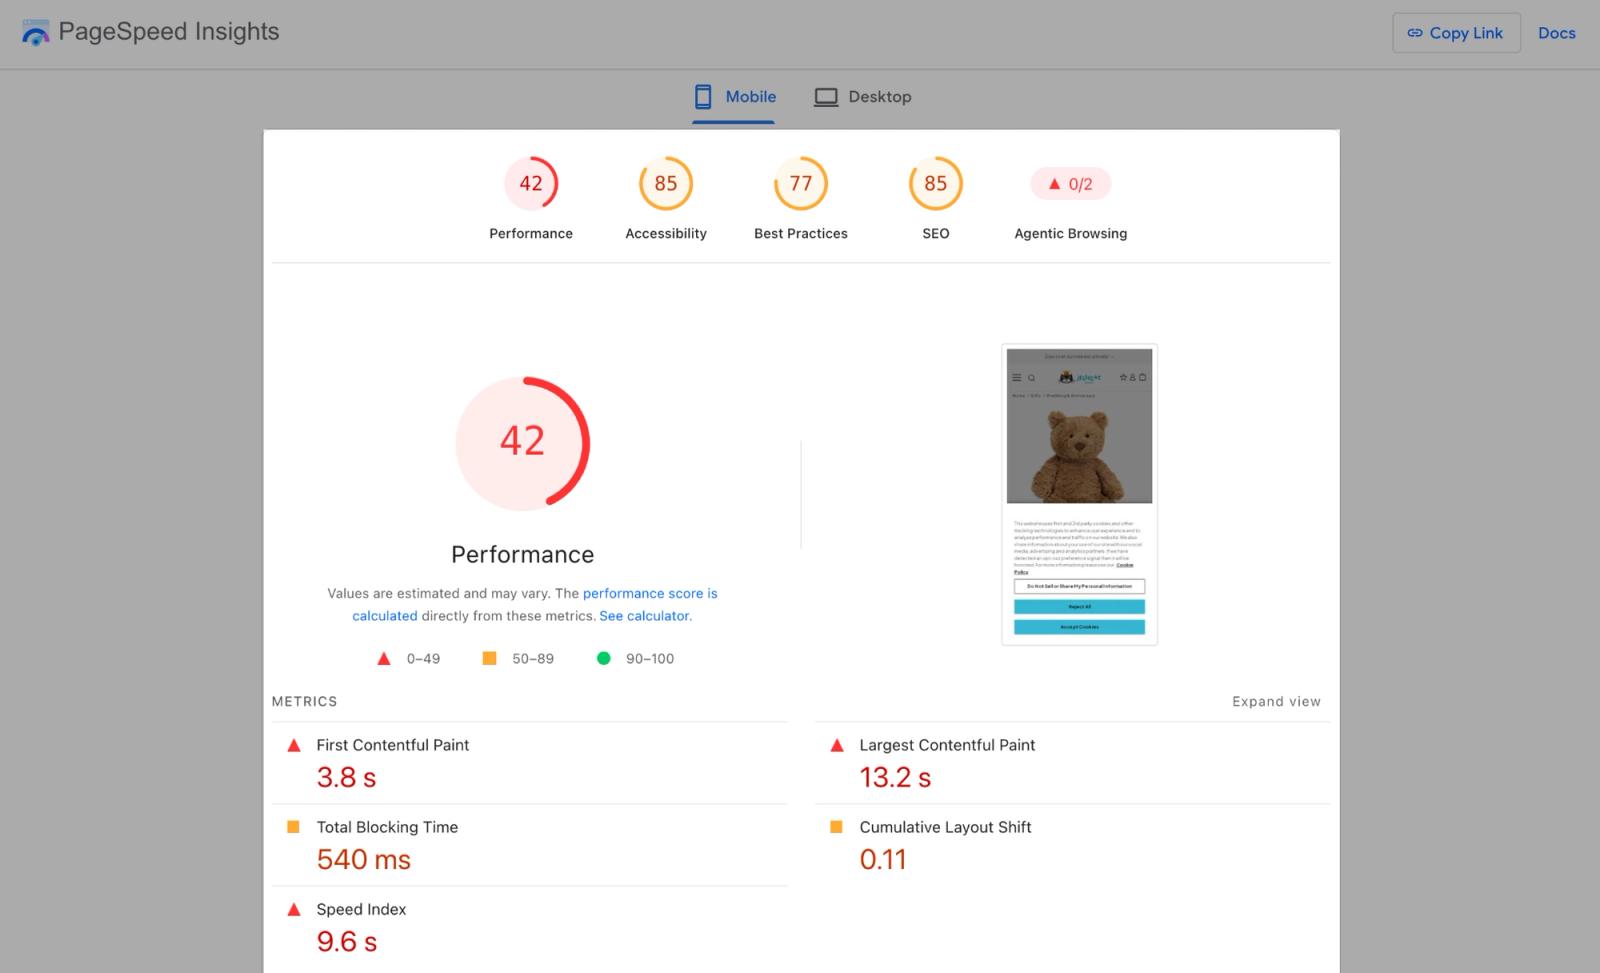
Page speed also affects every step in the funnel. A slow page drops sessions before anyone reaches the friction on it, so slow loading will show up as a weakness wherever it happens.
Load your slowest product page on a mobile connection and time how long it takes before someone could tap the buy button. A checker like Google’s PageSpeed Insights will show you what’s holding it up. If that page is slower than the rest of your templates, page speed is its own line on your backlog.
Fix the friction between cart and payment
Both your ecommerce funnel steps and the CRO metrics you use to find leaks work the same wherever you sell. What’s different in the UK, though, comes down to legislation around data protection, communications consent, pricing transparency, and delivery expectations.
Here’s what applies, where it shows up, and what to look at first:
Rule | What it requires | Where it shows up on your site | What to check |
DMCC ban on drip pricing | Show the total price, including mandatory fees and taxes, from the outset, with no unavoidable charges appearing later in the journey. | Category page, product page, cart, payment stage in sequence | The first price a shopper sees matches the amount at the payment stage. Any gap made up of compulsory charges is a problem. |
Value-added tax (VAT) in pricing | Include VAT in the prices shown to consumers. | Anywhere a price appears | Tax sits inside the displayed total the shopper sees. You don’t have to itemise VAT, but you can’t add it on top at the payment stage. |
Delivery cost stated up front | Give the delivery cost, or the rule that sets it, before someone commits. | Product page, cart, delivery options | Where the price depends on postcode, publish the price bands and name any surcharge. |
Privacy and Electronic Communications Regulations (PECR) consent for marketing messages | Get consent before you send marketing messages, unless the soft opt-in for existing customers applies. | Sign-up form, check-out opt-in, account creation | Pre-tick nothing, and record marketing consent per channel, not once for everything. |
UK General Data Protection Regulation (UK GDPR) lawful basis at data capture | Record your lawful basis, state what you’ll send, and let people withdraw. | Sign-up form, privacy notice, preference centre, unsubscribe link | Store consent with a timestamp and source against the customer profile, giving you a record of where it came from. |
*Disclaimer: This is general information. Check your own set-up with your legal team.
Full price from the outset
Lead with price, the rule with the sharpest enforcement behind it.
Someone who sees £68 in the cart and £74.99 at the payment stage has watched the price move after committing. That’s called “drip pricing,” a headline price that grows as unavoidable fees appear later in the process. Under the DMCC, you have to show the total price from the outset, including mandatory fees. The CMA found that the AA Driving School and the British School of Motoring (BSM) added a £3 booking fee that only appeared at check-out. The ruling cost them £4.2 million in fines and over £760,000 in refunds to more than 80,000 learners.
Find below how AllSaints (left) resolves everything in the cart with a £184.00 total that matches what the brand charges at the end. Nothing (right) takes a different approach on a £519 phone, showing the tax inside the subtotal and flagging delivery as “calculated at the next step,” so the brand names the outstanding cost. AllSaints doesn’t itemise the tax. Nothing does, at £86.50 inside the £519. Neither has to. And while itemising VAT is a choice, adding it after the fact isn’t.
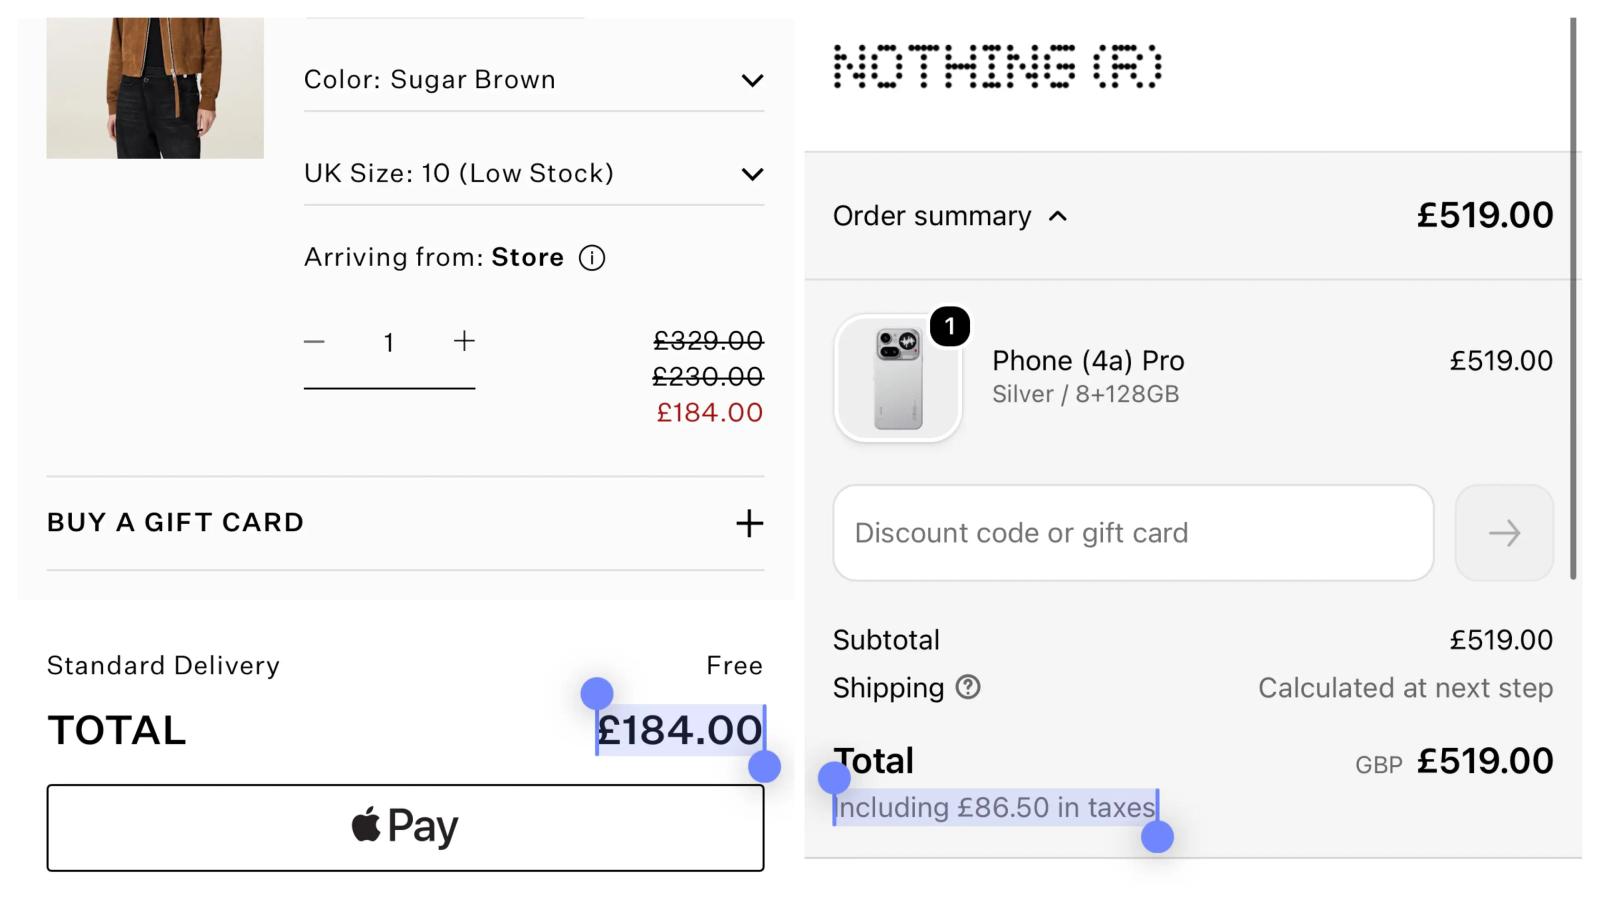
Shoppers know what VAT is and may expect a delivery charge. What people can’t account for is a fee that gets revealed exclusively at check-out without any traceability to anything earlier. Put upfront costs, or the rule that sets those costs, on the product page, avoiding surprises at the payment stage. If customers only see your store’s final prices at check-out, that’s a priority fix.
Delivery options before the check-out forms
State the delivery option, its cost, and window before someone types an address. Give the cut-off in plain terms, as in, “Order before 3 p.m. for next working day, excluding weekends and bank holidays.” Offer next-day delivery where you can, and say what you offer where you can’t.
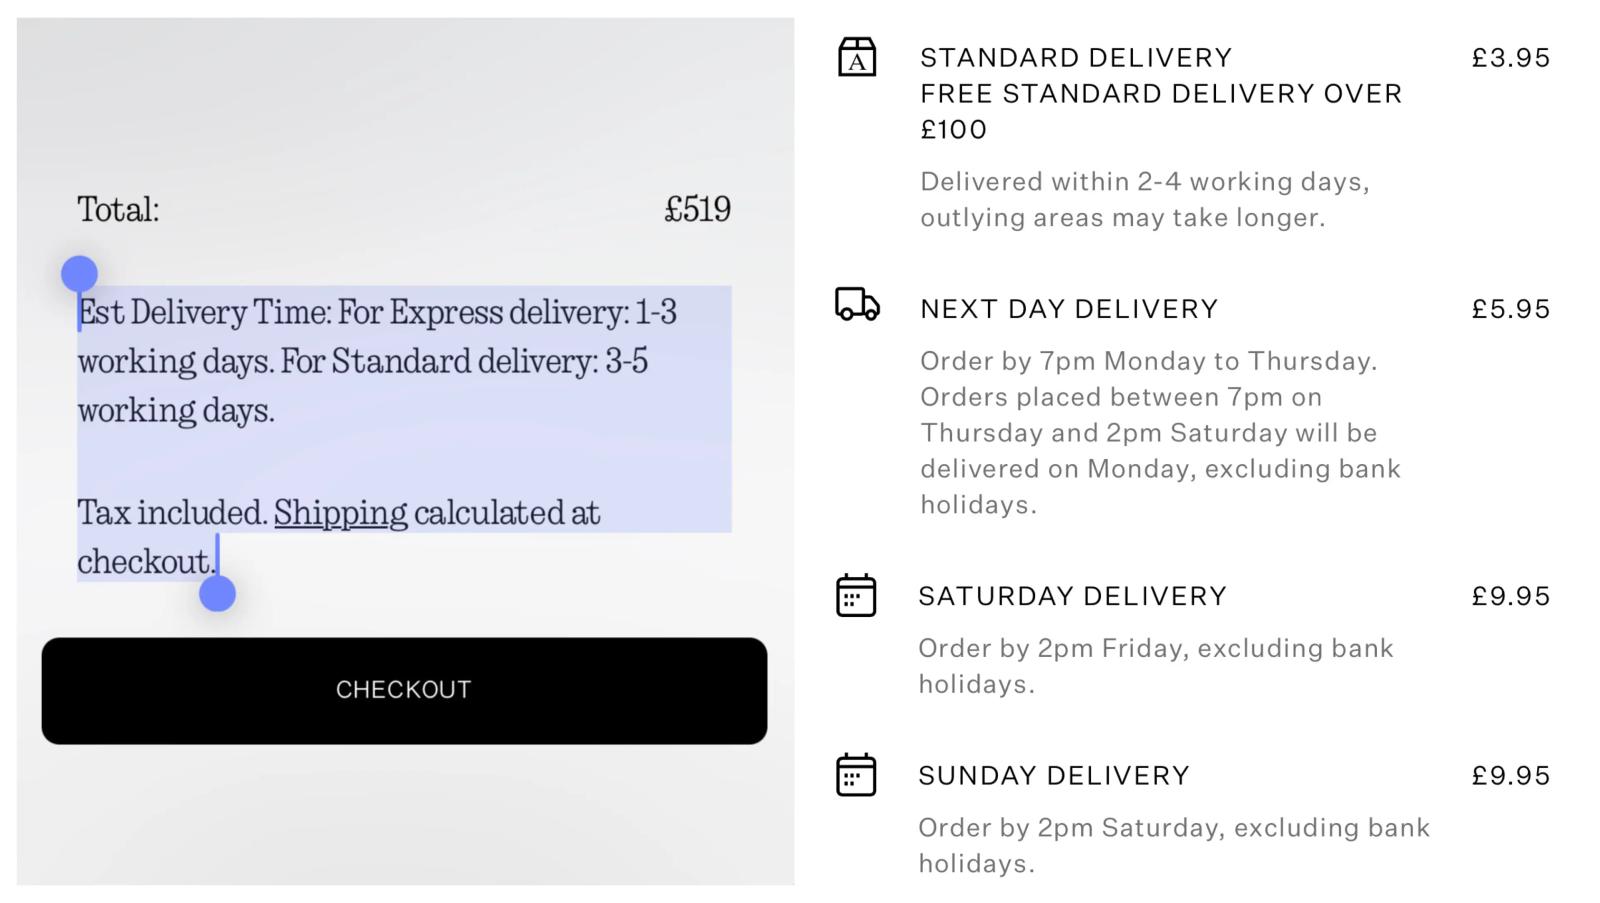
The examples below accomplish this at different levels of detail. The Nothing cart states the delivery windows and the tax status directly above the check-out button, leaving only the delivery cost to calculate. AllSaints prices each option separately with its cut-off attached.
How much detail you need depends on how much your delivery pricing varies. A flat rate can go in the cart the way Nothing (left) does it in the example below. Bands that shift by postcode or by cart size could benefit from the AllSaints (right) treatment, where each delivery option available is explicitly priced so a shopper sees which one applies to what they want.
Whether any of this costs you customers’ orders is a question your own ecommerce funnel answers. If the drop between the delivery options and the payment screen is wider than the drops on either side of it, zoom in on delivery and hypothesise about what might be driving it.
Express check-out at the front of the payment stage
Wallet buttons at the top of a check-out form, also known as accelerated or express check-outs, draw on the payment and delivery details a shopper has saved either on a mobile or desktop device, so returning customers can pay with those details filled in automatically.
In fact, research from the British trade association for the banking and financial services sector, UK Finance, found that approximately 37.6 million UK consumers (more than 6 in 10 adults) were “registered to use at least one mobile wallet service,” while “58% used mobile payments to purchase goods or services at least once a month.” As mobile wallets grow in popularity, express checkout can make entering payment details frictionless for more than half of UK adults.
Shopify sequences express check-out buttons dynamically. Stripe does the same, displaying the payment methods most likely to convert based on the customer’s location and past usage.
The image below shows two express check-out blocks. The Body Shop (left) runs 4 express check-out methods: Shop Pay, PayPal, Apple Pay, and Google Pay. An “OR” divider and a contact details section sit underneath, so a shopper paying by card can see where to go instead. ELEMIS (right) offers only Apple Pay and PayPal, right above where shoppers enter personal information.
How many mobile wallets you enable depends on your ecommerce platform, payment settings, shopper’s device, and what your customers actually use. Both The Body Shop and ELEMIS put the express check-out above the point where someone enters contact details. With 58% of UK adults paying by mobile wallet, the express check-out route goes first and the card route follows.
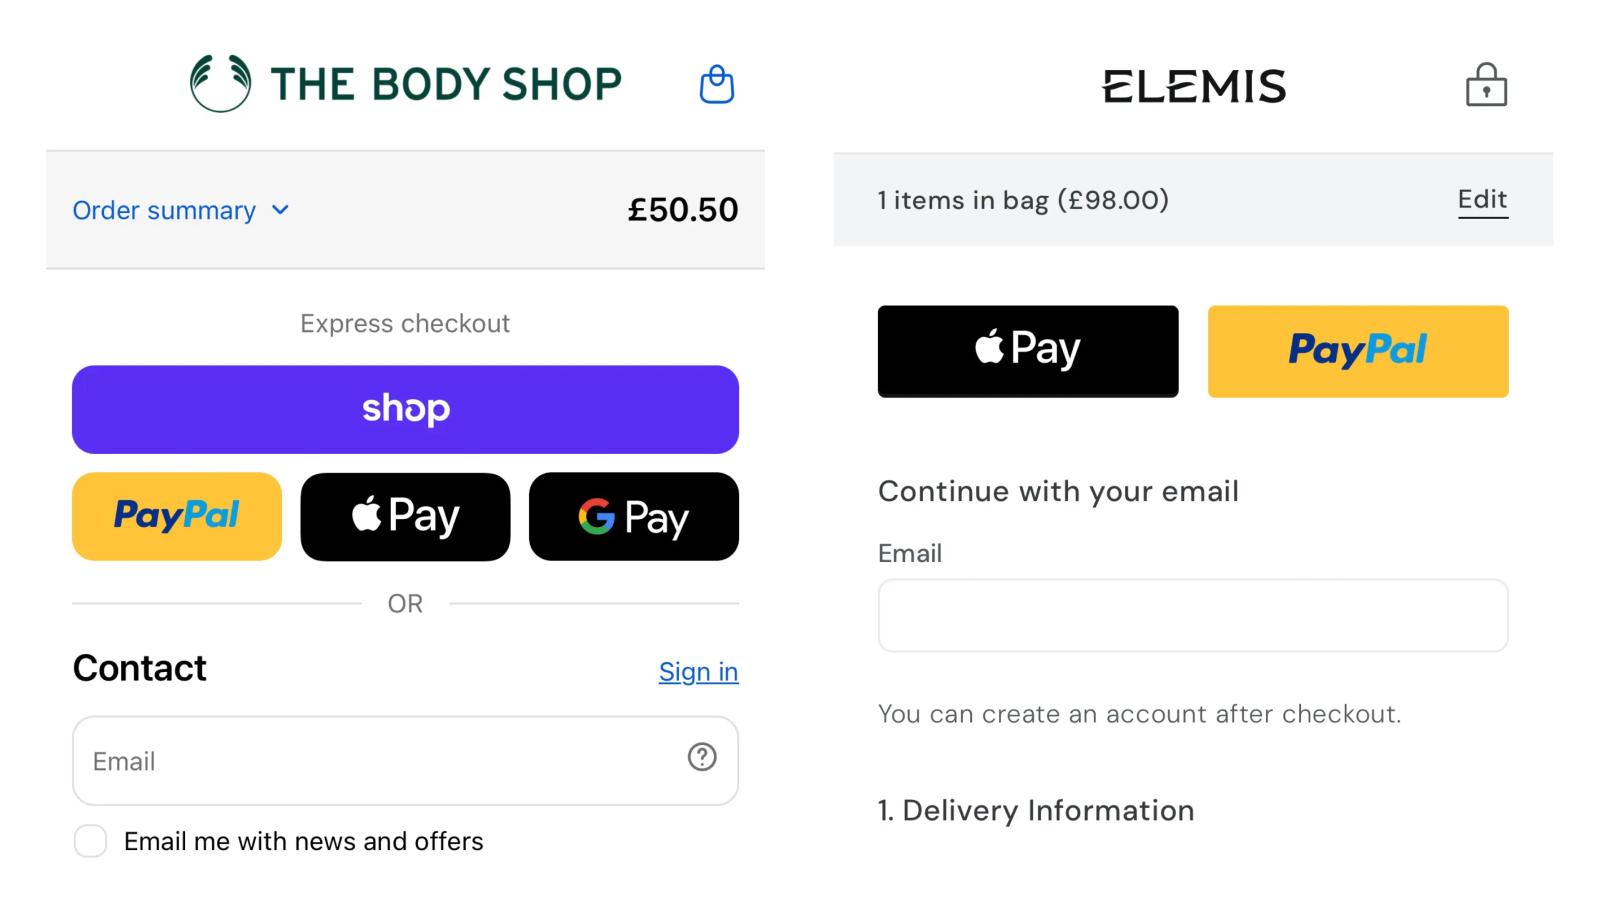
Confirm whether express check-out is switched on, whether it’s above the contact details, and whether the path for people who don’t use wallets stays obvious. If this block is below the personal information section, the shoppers most ready to pay don’t see the fastest route.
BNPL where the decision happens
Buy now, pay later (BNPL) is a growing payment method, but where you show it is a merchandising decision. If you’re running Shopify Payments, Stripe, or a similar set-up, the payment step list is often the default placement. It doesn’t have to be the only one, though.
Below, see how AllSaints (left) puts Clearpay and Klarna in the cart alongside other methods, so the option shows up a step before payment with no figures attached. Oh Polly (centre) adds a subtle line under the “Add to Bag” button on the product page, linking through to the options. And New Look (right) does the maths, putting the instalment amount on the product page against the item itself.
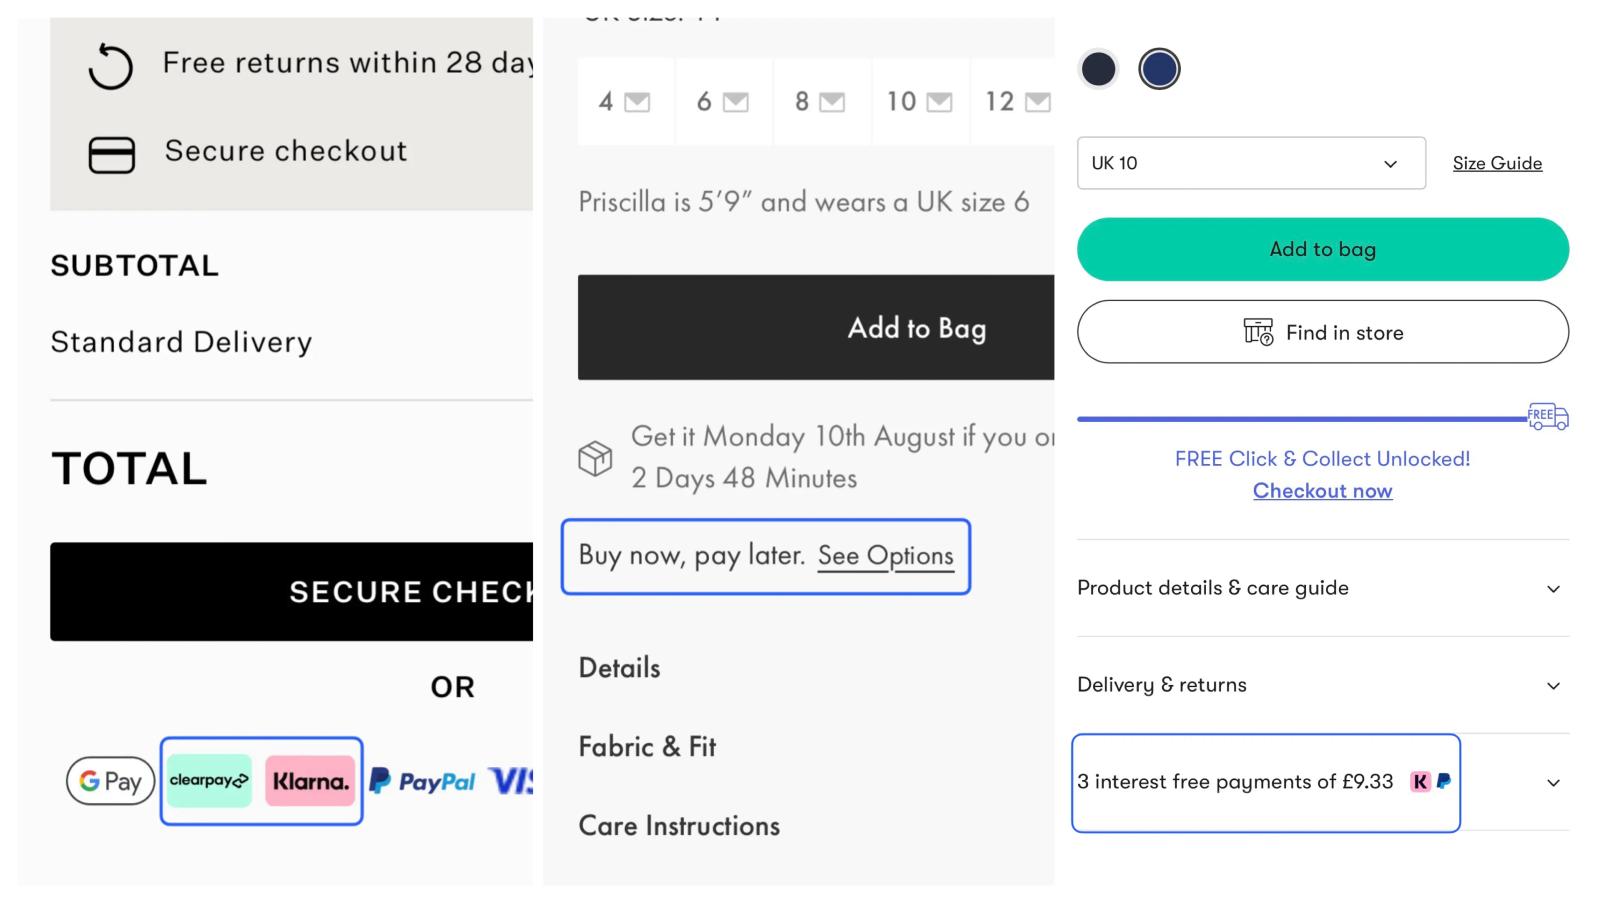
Some shoppers use BNPL to spread a cost they could cover outright. Others try a few products and send one back before paying in full. BNPL carries a merchant fee. Before switching it on across your catalogue, identify which products it moves and whether those products carry the margin for it.
Thresholds set against your numbers
A delivery threshold pitched slightly above your AOV may give shoppers a reason to add one more item. Someone £8 short of free delivery can spend £10 and get something back for it.
Pitched too far above, it stops serving as a nudge. If your store’s AOV is £45 and the threshold is £100, a shopper has to more than double their cart to reach it, so the line reads as the price of delivery rather than a reason to add another item. Start with your AOV, then compare it against peer group benchmarks to land on thresholds that make sense for an online brand like yours.
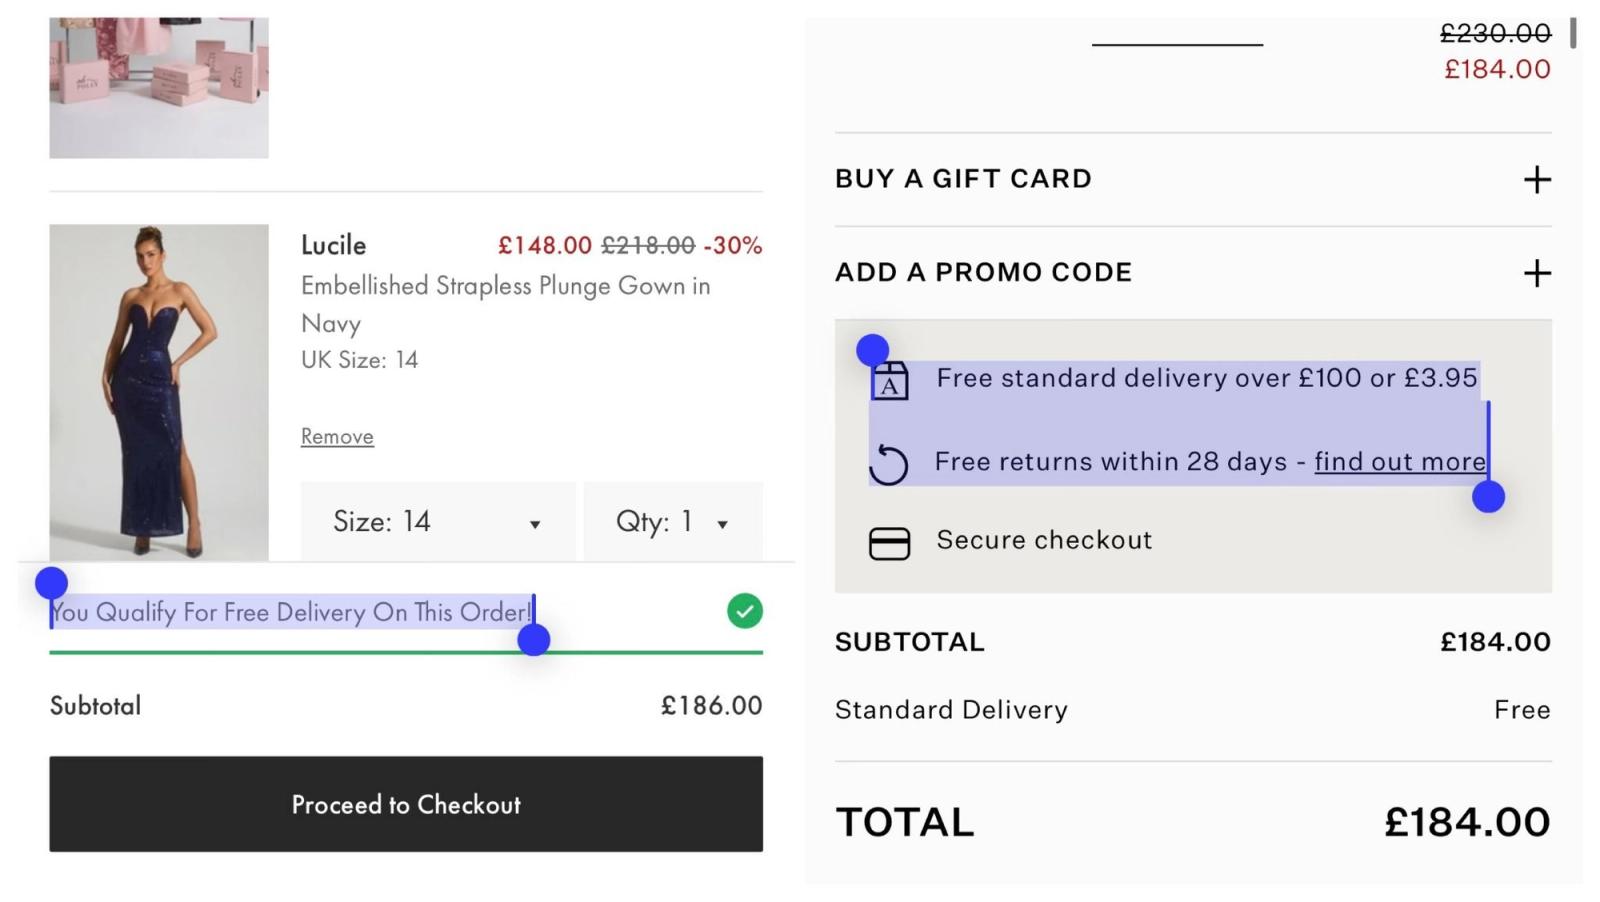
Thresholds only work if shoppers know where they stand against them. Notice how Oh Polly (left) tracks when a cart qualifies and tells shoppers how much further they have to go when they haven’t qualified yet. AllSaints (right) states the rule and the alternative in a single line, alongside its returns window.
Returns need the same discipline. Imagine a store with 2,000 orders a month and a 20% return rate. That’s 400 parcels coming back, and at £4 of return postage, you’re paying £1,600 a month.
Now, say 5,000 sessions a month get as far as the check-out, and you estimate that paid returns stop 5% of them from finishing. Winning those back means 250 sessions at £1.89 RPS, or £473 a month. Free returns cost more than they recover at that return rate. They’d break even at around a 6% return rate, and below that they pay for themselves. So check your rate against category data first, since a return rate that looks alarming in isolation may be ordinary for what you sell.
Prioritise your remaining CRO backlog by value against effort
What’s left is a backlog of two kinds of fixes, in no particular order yet:
- Usability fixes: Changes that remove friction for shoppers who already want to buy.
- Uncertainty fixes: Changes that answer the questions stopping someone from buying.
Price the CRO fix. Take the monthly sessions lost at the step the fix affects, estimate how many you could recover, and multiply those potential recovered sessions by your RPS. This is called “opportunity sizing,” and the recovery rate stays an estimate until you test the fix. For example: a category page losing 8,000 sessions a month, with a fix that recovers 5% of them at £1.89 RPS, is worth about £756. The same 5% on a product page losing 60,000 sessions is worth £5,670.
After you’ve sized the remaining backlog of CRO opportunities, map against implementation efforts to see what to ship this week, what fixes to schedule, and what to park for later.
Low effort | High effort | |
High value | Ship this week: “Add to cart” above the fold on mobile, express check-out above the fold, delivery cost on the page, compressed images on your best-selling template | Schedule it: product page rebuild, landing pages matched to traffic source, and help resources, whether that’s a size guide, a compatibility checker, or a coverage calculator |
Low value | Do it next time you touch the page: microcopy, button styling | Park it: redesigning a page few people reach, a quiz for a low-traffic category |
Log each CRO fix as you ship it, so you can compare the result against your estimate:
CRO fix | Sessions per month | Estimated monthly value | Effort to ship | How you’ll know it worked |
Show delivery cost and cut-off on category page | 8,000 | £756 | Theme edit, half a day | Category-to-cart rate against the same month last year |
Rebuild the product page template | 60,000 | £5,670 | Design and build, 3 weeks | A/B test, mobile traffic only |
Note: illustrative figures, with the monthly session values calculated from the IRP’s £1.89 RPS and a 5% recovery assumption estimate. Effort to ship column is your team’s time, use your own.
A CRO fix in the low value, high effort quadrant of the value and effort matrix isn’t a bad fix. Its sessions, value, and effort put it there at the moment you ranked the fix. Those inputs change as your store does. Recalculate when more web sessions reach the funnel step the fix affects, when the drop-off at that step widens, or when the fix turns out to cost less than you estimated.
A/B test within the limits of your own traffic
Most changes you test won’t move anything, and that’s the normal result. Ronny Kohavi, former vice president and technical fellow at Airbnb, said on Lenny’s Podcast that, of 250 experiments his team ran, “92% failed to improve the metric that we were trying to move.” Those experiments still added up to a 6% revenue increase. The wins were few, but they compounded.
When A/B testing, make sure you:
- Isolate one variable. Change two things at once and you’ll know something worked, without really knowing what.
- Pick your metric before you start (e.g., conversion rate, AOV, or RPS).
- Run the test long enough with a large enough sample size to trust the answer. Kohavi has calculated that detecting, for example, a 10% change on a 3% conversion rate needs around 52,000 users per variant, or over 100,000 in the experiment, drawing on research paper A/B Testing Intuition Busters. Below that, you can run the A/B test and still learn nothing. What you choose to test in ecommerce decides how long you wait for an answer.
If your store’s traffic doesn’t reach those numbers, testing marginal tweaks is time you won’t get back. Kohavi’s advice there is to go after changes big enough to show up without a test, and to lean on qualitative research. That means customer interviews, web session recordings, exit surveys, support tickets, returns reasons, and review text mentioning fit or delivery.
None of that returns a significant figure, and it doesn’t need to. A 5-person usability session on a bestselling product page can teach you more than an underpowered test on a button colour.
Without a test, the comparison has to supply the control. Measure before and after against the same month last year, on the same device and traffic source, and treat the results as directional.
Recover the shoppers your check-out doesn’t convert
People get interrupted, compare prices for longer than you’d like, or mean to come back and forget. Even a flawless check-out can’t stop abandonment. Recovering those shoppers takes consent captured, answers where doubt shows up, and activity-based marketing automations.
Data capture that makes follow-up possible
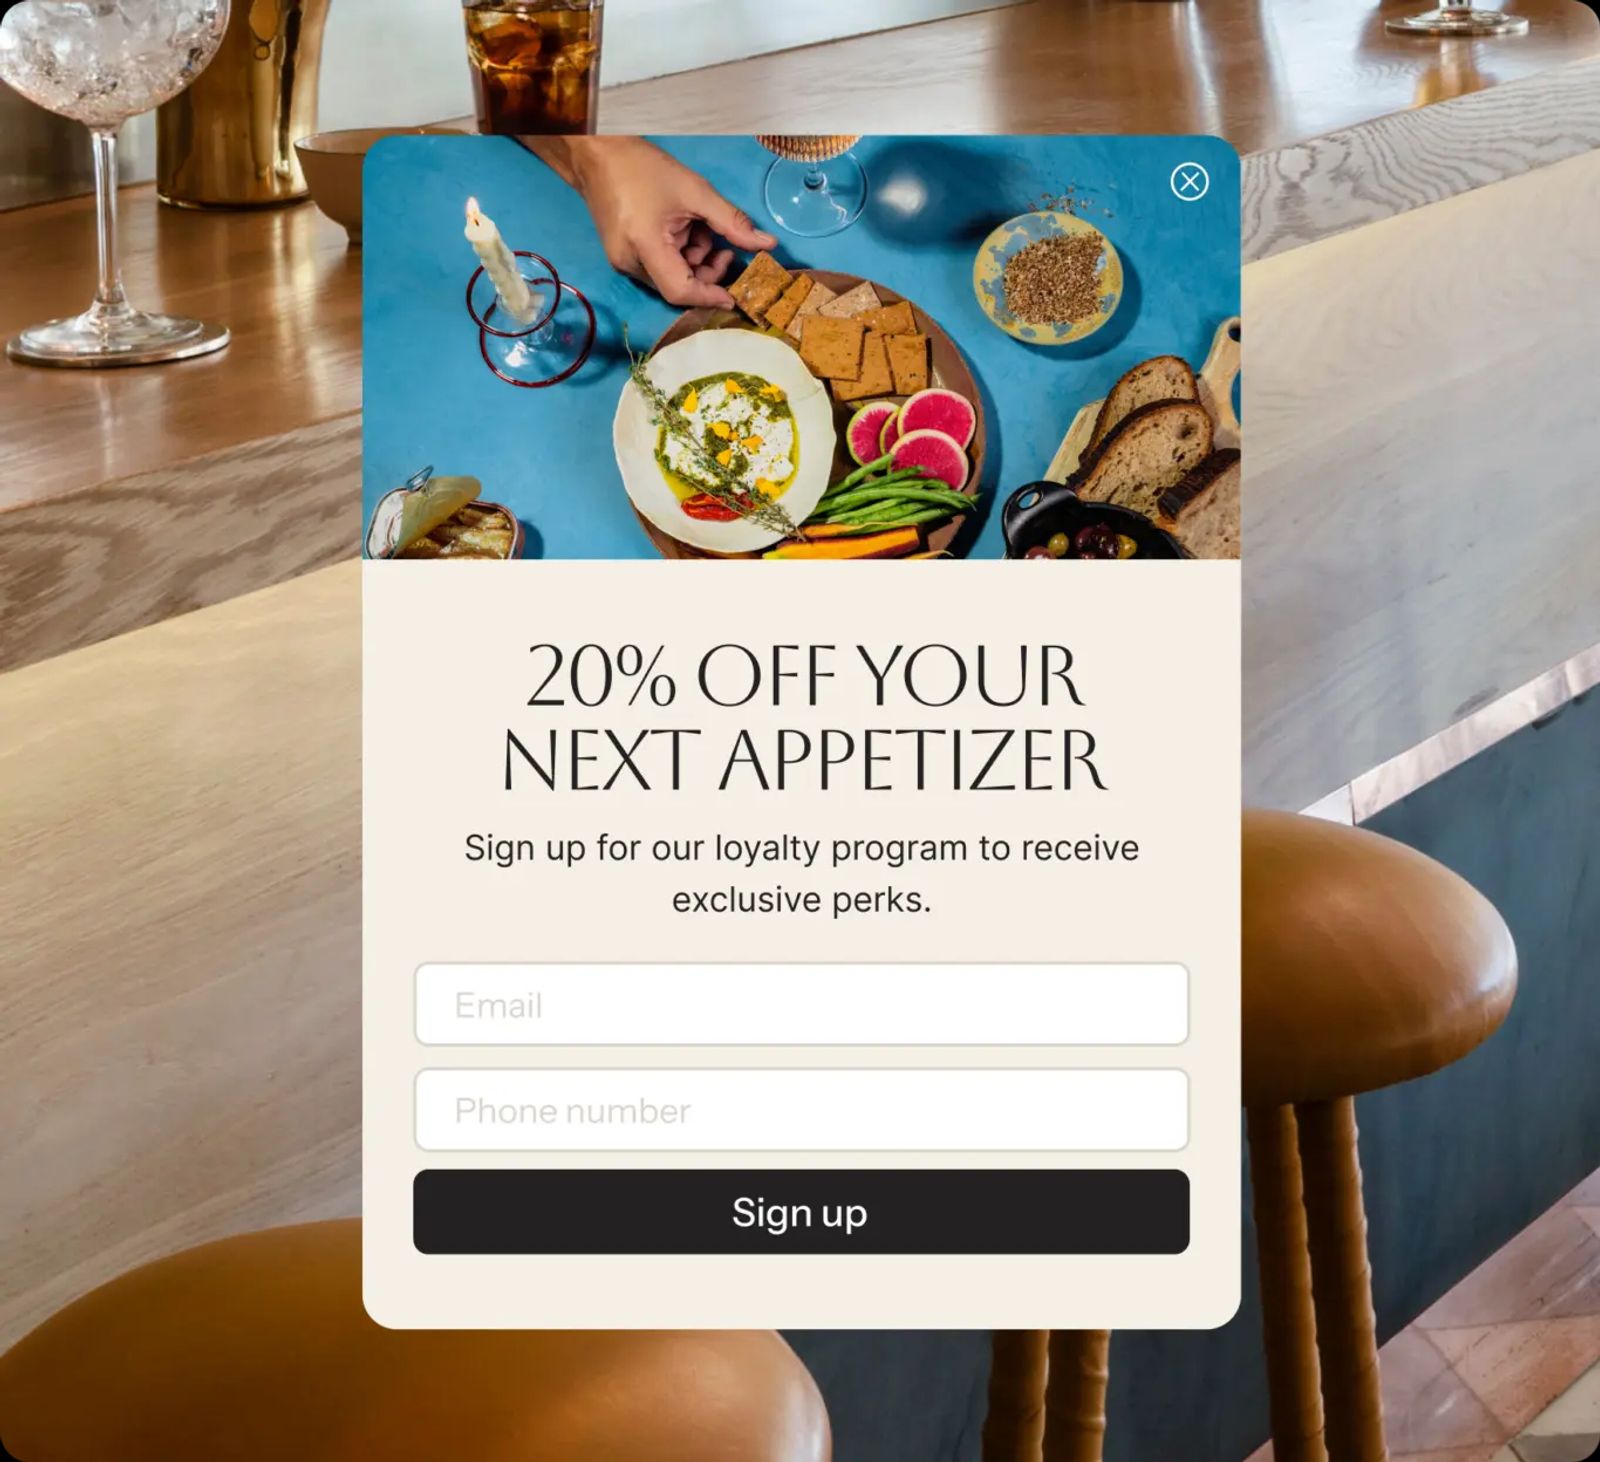
No funnel report counts an unreachable visitor as a loss. But a well-timed pop-up form asking for an email address and an optional phone number, in exchange for an offer (e.g., a welcome discount or free delivery), gives you a profile you can follow up with instead of an anonymous web session.
With sign-up forms, timing and targeting move your capture rate as much as the offer does, so consider when the form fires (e.g., on entry, at a scroll depth, or on exit intent) and who sees what (a first-time visitor from paid social might see your standard sign-up form, while an existing email subscriber sees an SMS-only version).
Data capture is also where you record consent, and consent is what makes follow-up lawful under PECR and the UK GDPR.
Support that resolves doubts from browsing to payment
Hesitation comes up while someone compares products, reads returns policies, or checks when an order would arrive. Support available at those moments (e.g., returns terms beside the “Add to cart” button, or an AI customer agent answering from your FAQ, knowledge base, or help centre) resolves the question exactly where it happens, instead of leaving the shopper to go looking.
The customer service side of your ecommerce CRM should cover that part of the customer journey. Running 24/7, an AI customer agent trained on your customer data and product catalogue answers sizing, delivery, and returns questions at the point of decision. When a question needs a human, the AI agent hands it over with full context attached, so your human team doesn’t have to dig for information and the customer doesn’t have to repeat themself.
Product reviews do the same work in the background, and they build trust while they’re at it. For a shopper who hasn’t bought from you before, customers’ reviews on product pages answer their questions more credibly than a brand’s marketing communications. Put ratings on category tiles so someone can choose what to open, full reviews on the product page near the price, and photo reviews alongside your product images, where a customer’s picture shows the item in use.
Trustpilot’s research on UK online reviews found that “consumers aren’t looking for a perfect record of only 5-star reviews,” with 83% saying occasional critical or constructive reviews add legitimacy. So moderate reviews for spam or abuse, but let the mixed record do the reassuring.
Flows and campaigns that act on what you found
Omnichannel cart recovery runs on flows, which are automated messages, or series of them, triggered by something a shopper does. They go out across email, text messages, WhatsApp, and mobile push notifications. Starting a check-out and not finishing it could trigger an abandoned cart email, for example. While viewing a product without adding it to the cart could trigger a browse abandonment flow.
Flows cover cart abandoners. But a group dropping off at one step, on a specific marketing date may need a one-off campaign built for that case (e.g., everyone who reached check-out on mobile last Black Friday and didn’t place an order). Rank campaigns the way you ranked your CRO fixes. Defining the segment, writing the copy, and designing the send is the effort, and the value shows up in the same conversion rate, AOV, or RPS metric you used to find CRO leaks.
An AI marketing agent for ecommerce shortens that queue by staging everything for your review and sign-off. It reads your prompt or goal alongside your past campaigns, flows, segments, and performance history to surface what to act on, ranked by likely business impact, then builds the audience, copy, design, channels, and timing for the marketing campaign or flow you choose.
Look beyond the page for your next conversion gains
Page-level CRO has a ceiling. Once your check-out works as it should and your pages load at a reasonable speed, the next round of gains comes from something you can’t see on the page: which flows people buy from, which channel different customers respond best to, which products people buy together, and which segments to prioritise in your omnichannel campaigns.
Klaviyo, the autonomous B2C CRM, ties each interaction from your store to a single customer profile. Channel reporting uses that data to show you straight away which channels convert. Product and order data arrive through integrations, so once you’ve connected one of the 350 pre-built options, Klaviyo Analytics reports on channel and product performance together.
You can start drafting flows and campaigns with Klaviyo’s AI marketing agent, Composer, which recommends actions based on your business data and leaves the last word to you. Pair it with Customer Agent to handle the enquiries that come in, answering from your catalogue, help centre, and policies, and routing shoppers to your service team when a case needs a person.
The ecommerce CRO diagnosis, prioritisation, and testing you’ve applied to your store can now go to work on your messages, channels, and the cart abandoners who left without buying.
Want to see which channels your customers convert on?

Related content