The problem
It’s often easy to identify the right key performance indicators to track for your business – north stars that tell you if your business is growing. Conversion metrics help you understand how you’re performing against those growth goals. For example, you might want to measure the number of orders placed to track an increase in sales, or the number of customers who purchased twice to track retention.
But pulling those results and connecting them to marketing impact is easier said than done.
- Beyond how many conversions were made, how many were influenced by marketing?
- How much revenue did that make up, and what was the average order value?
- How many customers converted, and how many times did they convert?
These are critical questions that you need to answer to truly understand performance, trends, and growth opportunities. Today, that might mean hours of exports and analysis, or trying to cobble together the right dashboard.
The solution
Klaviyo’s conversion overview dashboard gives you immediate answers so that you can focus on improving your marketing strategy. You can report on any conversion metric and compare any timeframes.
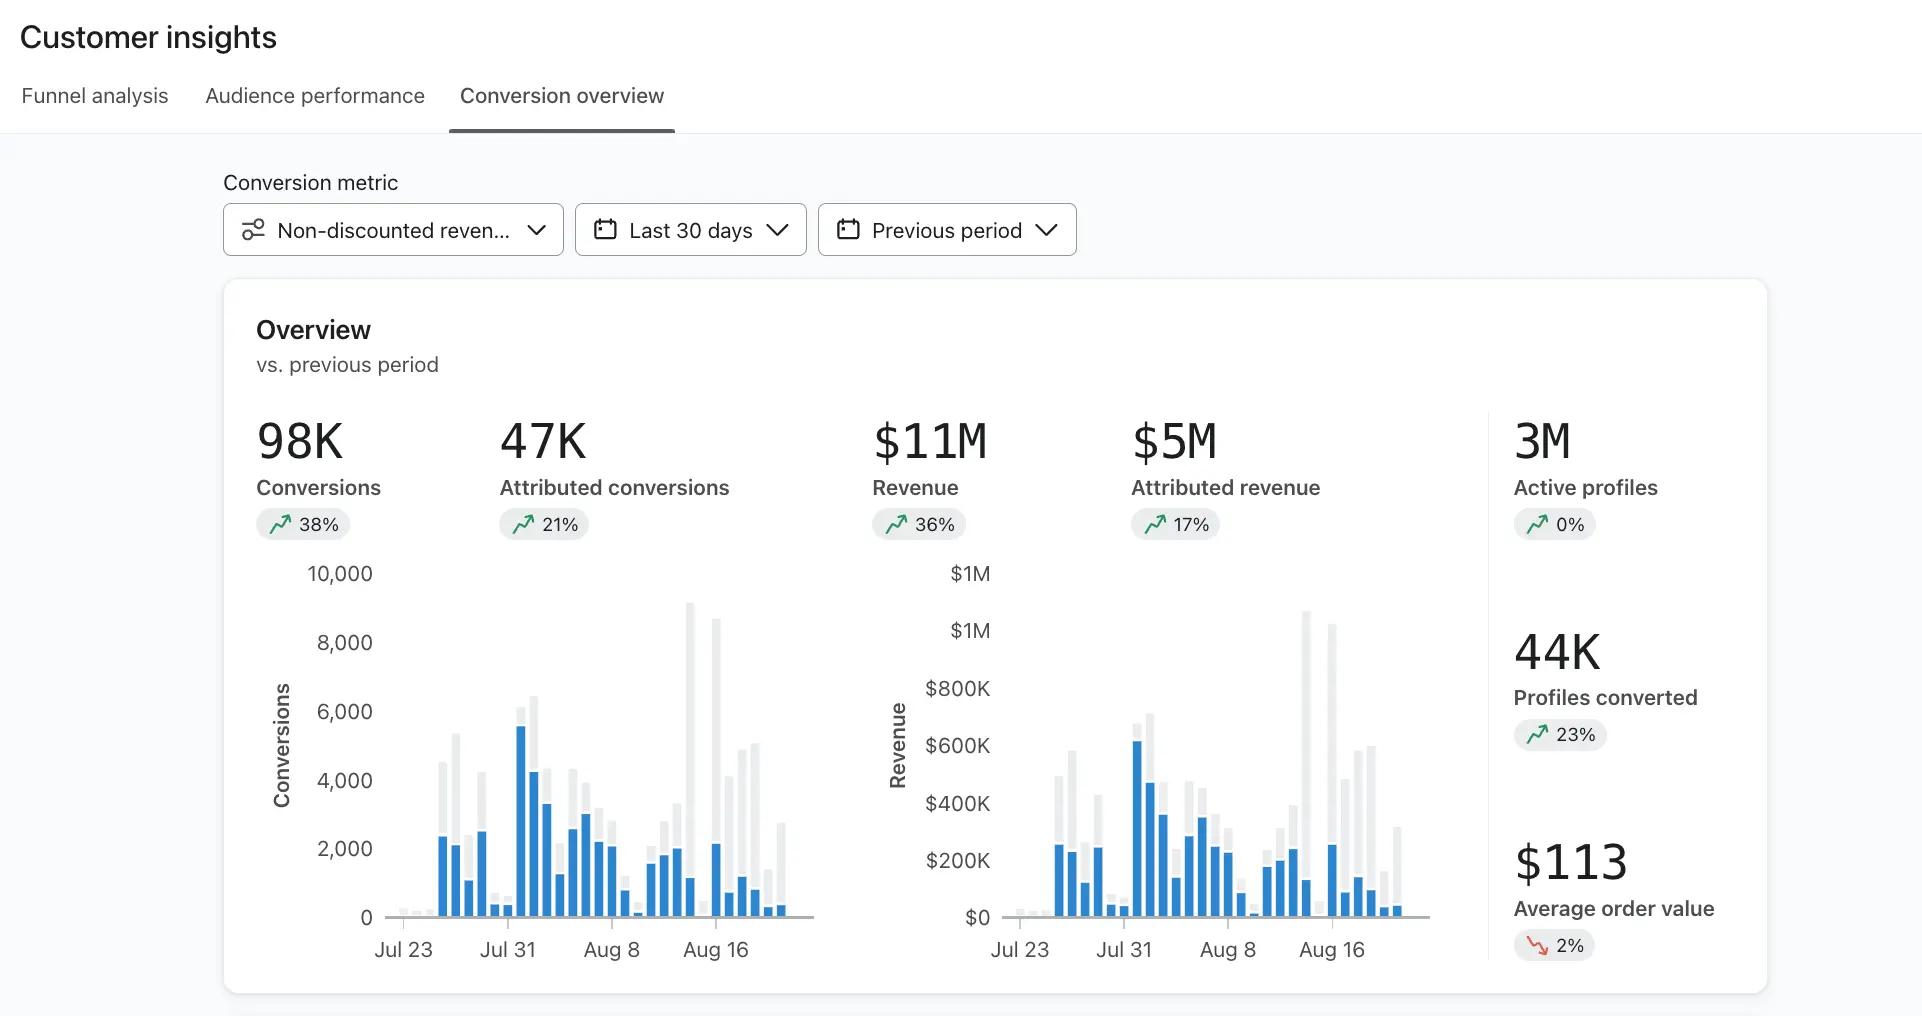
In the example below, it’s clear that:
- We’ve increased the number of orders placed without a discount in the last thirty days.
- We’ve increased the number of those conversions attributed to marketing.
- A campaign we ran in early August influenced a significant percentage of those sales.
- While the number of customers who converted has increased, the average order value has declined.
As a result, we’ll want to run the successful campaign from August again, and explore ways to increase average order values with complementary product recommendations. We’ll check this dashboard again to monitor trends in conversions and marketing impact.

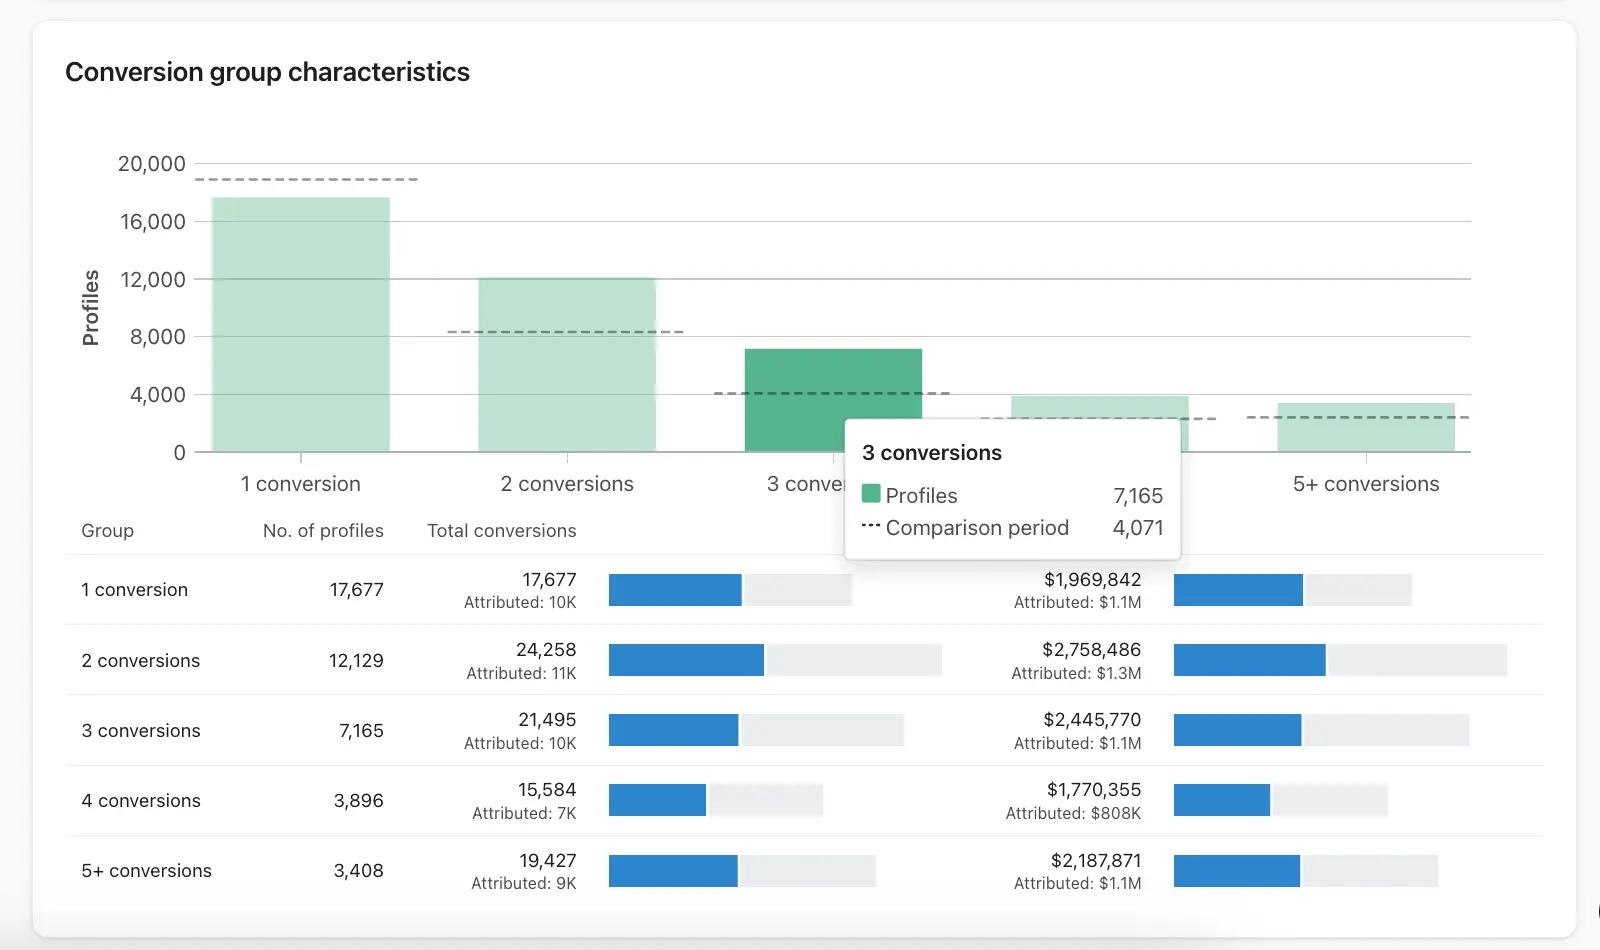
The conversion overview dashboard also groups customers by the number of times they’ve converted in the timeframe you set. By tracking repeat buyers in these groups, you’ll be able to analyze customer retention.
The example below shows more customers are making repeat conversions versus the previous time period. Marketing is influencing over half of the conversions from one-time buyers, but fewer than half of the conversions from repeat buyers.
As a result, we’ll prioritize retention efforts to influence and increase repeat purchases. We can launch a new post-purchase flow to recommend a refill or a complementary product.

Ultimately, the conversion overview dashboard makes it easy for businesses and marketers to report on changes in conversion over time, visually identify trends in how marketing influences conversions and revenue, and monitor repeat buying behavior – so that you have the data and insights you need to make strategic decisions.
Access the dashboard today
This dashboard is exclusively available for customers of Klaviyo Customer Data Platform (CDP).
Log in to check it out in your Klaviyo account.


