According to Klaviyo’s data science team, churn rates for average customers can be as high as 70%.
You can predict churn by using data analysis, machine learning, and predictive modeling to forecast which customers are likely to stop buying—or simply never buy again.
Based on time lapses that succeed the average buying cycle, churn prediction models help businesses proactively identify and retain customers who are most likely not to come back.
If you’re seeing churn prediction values around 50%, you’re in excellent shape with your customer base. But if you’re seeing churn prediction values above 75%, you have some decisions to make about retention strategies and prioritizing the customers who are more likely to come back.
“Churn prediction is absolutely crucial because it usually costs more to acquire a new customer than retain an existing one,” says Jessica Schanzer, lead product marketing manager at Klaviyo. “Once you can easily identify people that are at risk of churning, you can pivot and develop a marketing strategy to keep those customers.”
If you want to understand how churn prediction models work, why they’re increasingly important, and how to build one in Klaviyo, keep reading. Want to go beyond churn prediction? Check out these resources:
- A deep dive on how to reduce customer churn
- Top reasons customers churn—and how to course-correct quickly
Predicting customer churn is the best path to prevention
Depending on the nature of your business, it may be easier and cheaper to decrease your churn rate than acquire new customers. Data varies across industries, but recent findings suggest customer retention, or re-acquisition, is 6x cheaper than acquisition.
Thanks to customer data platforms (CDPs) like Klaviyo CDP, which are democratizing predictive models for brands, even the smallest brands are now able to automate churn prediction.
Because platforms like Klaviyo CDP house large amounts of customer data, even the smallest brands are now able to automate churn prediction.
Because platforms like Klaviyo CDP house large amounts of customer data, even the smallest brands are now able to automate churn prediction. This makes churn prediction table stakes for a successful customer experience strategy for brands of all sizes.
To help brands predict customer churn without a dedicated data analytics team, Klaviyo built a predictive churn AI model that leverages machine learning.
“Our model learns the purchasing patterns of your business,” says Christina Dedrick, director, engineering at Klaviyo. “Then, by using predictive modeling, we make profile-level predictions for your audience. These predictions update automatically in reaction to profile behavior and are available in segmentation and flow logic to design experiences around churn.”
By using predictive modeling, Klaviyo makes profile-level predictions for your audience. These predictions update automatically in reaction to profile behavior and are available in segmentation and flow logic to design experiences around churn.
Klaviyo’s AI models customize to your business and use cases and do the heavy lifting of a data science team natively on the platform, without the cost. And, it’s important to predict customer churn because you can do something about it.
When you predict customer churn consistently and understand why people are churning, you can:
- Run targeted retention strategies: Send email and SMS offers to customers you identify as high risk.
- Save money on customer acquisition: When retention rates go up, you may be able to decrease spend on paid ads, for example.
- Increase customer satisfaction: Send preemptive customer support messages or educational resources to customers you identify as high risk.
- Proactively improve products: Start the long process of redesigning products before your churn rate becomes a mission-critical issue.
- Gain a competitive advantage: Predict churn when it’s unlikely your competitors are doing so, and address issues they may be missing.
If you aren’t already using Klaviyo and want to do churn analysis on your own, here’s how:
Define what churn looks like for your brand
Before you can predict churn, you need to clarify what it looks like for your business. Here are a few questions to get you started:
- How much time needs to pass before we consider someone “churned”?
- For subscription-based businesses: How will we delineate between customers who cancel and customers who simply don’t renew?
Create a basic persona for what a churned customer looks like before you invest in a model to predict churn risk.
Develop customer segments with churn in mind
It’s a mistake to treat all customers who churn the same. First-time buyers who never buy again are different from VIP customers who stop buying all of a sudden. Split your customer churn persona into various segments so you can develop a sound plan to retain them.
Start gathering and centralizing customer data
If you have access to a data analytics team adept in machine learning models, this is when you tell them to get to work. But if you’re like most brands, you probably don’t have such a team. In that case, invest in a CDP that centralizes all your customer data so you can put it to good use—like predicting churn risk.
Wait for your sample to populate
Accurate models need a sufficient sample size. You may want to start predicting churn risk as soon as your CDP starts populating, but this is a surefire way to get skewed results.
At Klaviyo, for example, we require at least 500 customers to have placed an order for an accurate comparison of individual behavior against overall customer behavior.
Analyze your churn risk data in your CDP
When your business meets the data requirements, you’ll see a visualization that looks like this if you’re using Klaviyo:
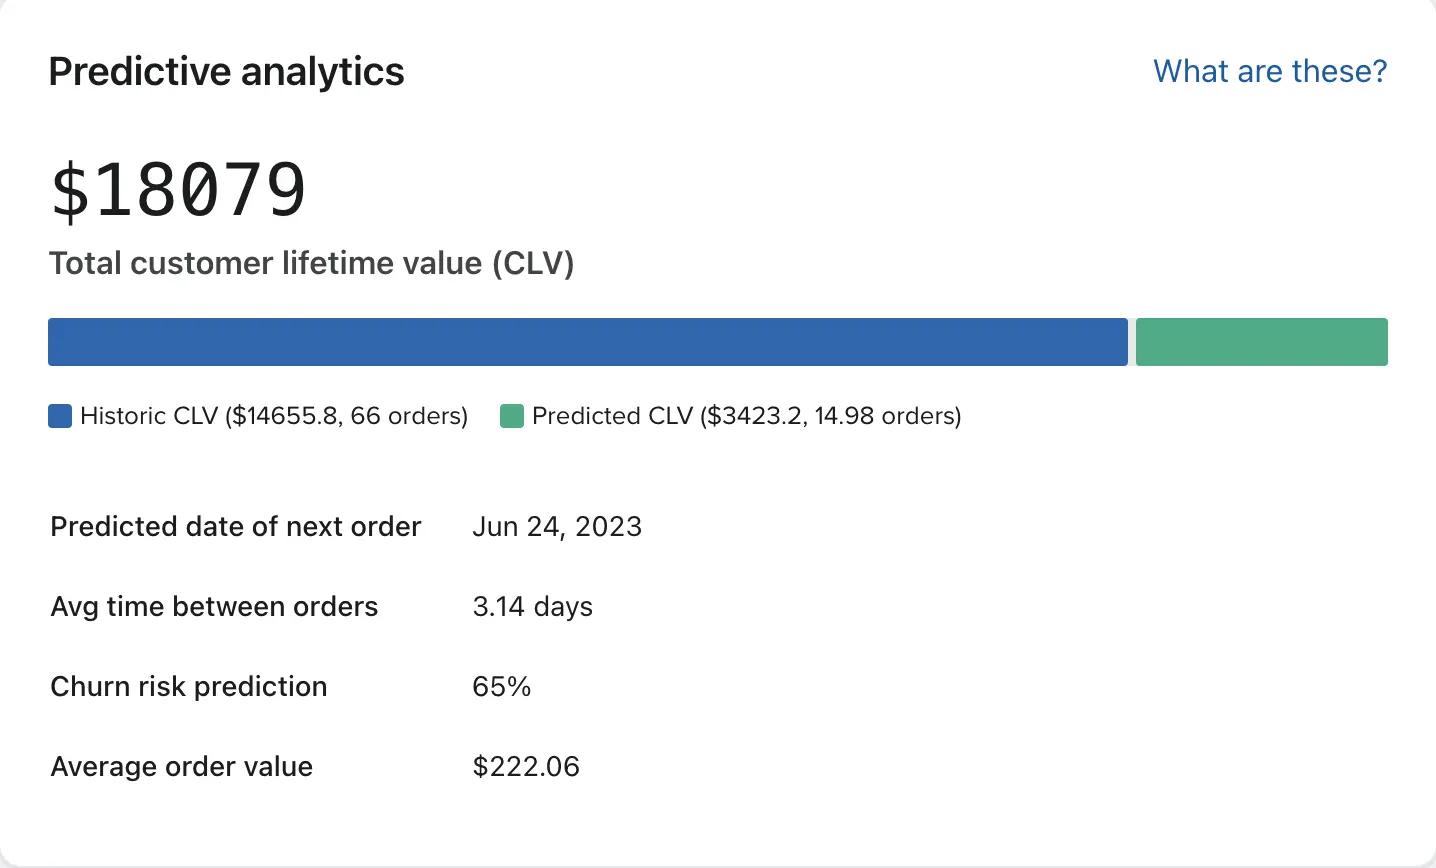
- The colored bar represents a customer’s total CLV.
- The blue section represents historic CLV—what the user has spent on your offerings so far.
- The green section represents predicted CLV—what we expect them to spend with your brand in future.
Below this, you can find the expected date of next order, the average time between orders, average order value, and the churn risk prediction at the moment you’re looking at the graph.
Monitor the model and take action
As you monitor your churn risk prediction model, you’ll start to see patterns in the types of customers most likely to churn. These patterns will determine which actions you take to reduce churn, whether it’s offsetting with more aggressive new customer acquisition tactics or a thoughtful churn reduction strategy.
How Klaviyo predicts churn
Platforms like Klaviyo use a variety of metrics and machine learning models to predict customer churn, but the key metric they lean on is CLV. CLV is calculated by considering the customer’s average purchase value, average purchase frequency, and average lifespan with your business.
To forecast CLV to churn risk, you need access to a lot of data points. This access allows you to compare individual CLV to a variety of metrics within your entire population of customers.
This is where many churn prediction models, including highly cited academic models, fall short—researchers at academic institutions only have access to publicly available data.
Klaviyo, by contrast, uses a high volume of real-time data to refine its churn prediction models over time.
It’s all about the quality and quantity of your data. The more robust your real-time and historical data, the more accurate your churn prediction models will be. The more accurate your churn predictions are, the more customers you can retain.
“It’s all about the quality and quantity of your data,” Schanzer explains. “The more robust your real-time and historical data, the more accurate your churn prediction models will be. The more accurate your churn predictions are, the more customers you can retain.”
Let’s dig in to how Klaviyo predicts churn, then compare it to models in academic literature in more detail.
Klaviyo’s churn risk model in action
Klaviyo’s churn risk model begins with some rules. These criteria are in place to make sure the churn prediction is as accurate as possible:
- The business has at least 500 customers who have placed an order. This is the sample size required to compare individual behavior to a large enough segment of your overall customer behavior.
- The business has at least 180 days of order history and has orders within the last 30 days.
- The business has at least some customers who have placed 3 or more orders.
Klaviyo’s model is trained on the history of your customers. To score a customer’s individual churn risk, the model incorporates the following in addition to CLV:
- Number of orders
- Time between orders
- The most recent order
Generally, when a customer purchases, they are at a low risk of churn. Then, as time passes, their churn risk gradually increases as the time since last purchase lengthens.
But the model isn’t that simple—it also learns over time, based on how frequently a customer actually purchases.
For example, a customer might wait 100 days between orders. Over time, their risk of churning might remain lower for longer than for a customer who typically waits, say, 50 days between orders, according to the business’s unique customer churn prediction model.
Klaviyo’s model is further refined by comparing individual purchase behavior to similar behavior across your business’s customer population, especially when it comes to the behaviors that lead to repeat purchases. As a result, every company has a unique churn model.
Klaviyo doesn’t use customer population data from other companies to inform churn risk (nor share that training data between accounts), because that data wouldn’t necessarily apply to your unique business.
How do we know the new Klaviyo model performs better than the academic models?
Generally, the larger the data set, the more accurate the results.
In our research phase, Klaviyo’s data model was trained on 700 data sets, whereas many of the academic models we researched were trained on just 3.
And without a minimum data requirement, the academic model uses sample sizes that are too small to reflect reality. Publicly available data on customer churn rates is limited and may not apply to the vast majority of businesses.
The academic model is overly optimistic, assigning a medium 40-70% probability of churn to a large number of customers. But when we compare these predictions to real customers in Klaviyo, we see that 88-97% of these medium-risk customers churn—showing the academic model can’t differentiate between medium-risk customers and high-risk customers.
Then, there’s the problem of…Poisson.
No, we’re not talking about fish. In data analysis, a Poisson distribution represents the probability of an event happening a certain number of times within a given interval of time.
When Klaviyo’s data analysis team first began to examine academic models of churn prediction, they noticed a massive error: most The models used a Poisson distribution to simulate purchasing behavior, but the data feeding into it was not shaped like Poisson data.
As a result, customers were assigned a low predicted churn rate—because some of them were predicted to make a purchase within the next 100 years. The academic model was mixing up the time recurrence prediction and the churn prediction because the real data did not match the Poisson distribution that was required.
The academic model is overly optimistic, assigning a medium 40-70% probability of churn to a large number of customers. But when we compare these predictions to real customers in Klaviyo, we see that 88-97% of these medium-risk customers churn—showing the academic model can’t differentiate between medium-risk customers and high-risk customers.
Churn prediction FAQs
How to start using churn prediction?
Predictive analytics for ecommerce businesses are improving at breakneck speed. Use Klaviyo’s data modeling to help you scale and improve your marketing strategy.
How does churn rate impact revenue?
Churn rate represents lost revenue because it’s the rate at which customers are leaving the business. Higher churn rates mean not only that a large number of customers aren’t coming back, but also that they’re not spreading positive word of mouth about your business.
How can brands calculate the churn rate?
To calculate churn rate, divide the number of customers who have churned during a period of time by the total number of customers at the beginning of that period, then multiply by 100 to get a percentage.
Read more from Klaviyo’s Approach:
Power smarter digital relationships with Klaviyo SMS.
Get started
Related content