2026 email performance benchmarks
Generated by Klaviyo AI
This article shares 2026 email marketing benchmarks for open, click, and placed order rates across industries, based on data from over 183,000 brands. It explains why each metric matters, how campaigns compare to automated flows, and which optimisation tactics can improve engagement and revenue.
- Core 2026 benchmarksThe article outlines average and top 10% open, click, and placed order rates for email campaigns and automated flows across industries.
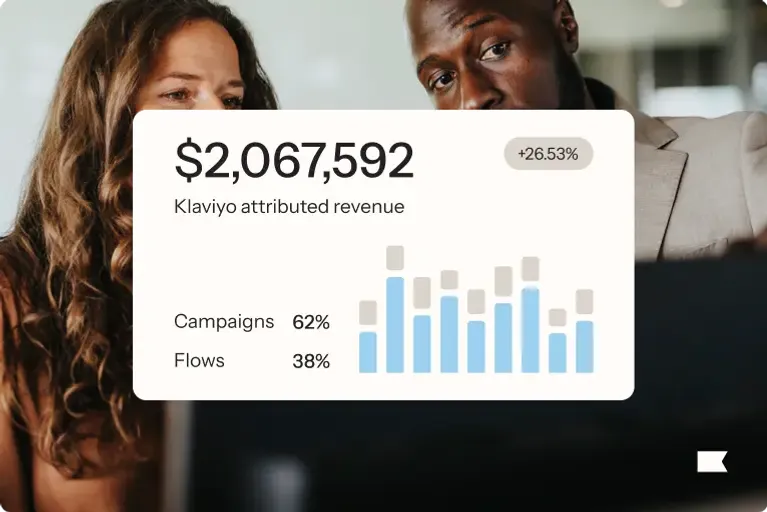
- Campaigns vs. flowsAutomated flows significantly outperform campaigns, delivering around 3x higher click rates and 13x higher placed order rates, and generating nearly 41% of email revenue from just 5.3% of sends.
- Industry variationBenchmarks differ by industry, with open, click, and placed order rates varying by up to about 2%, though most sectors fall within similar ranges.
- Improving engagementPractical tips include testing and refining subject lines, CTAs, and send times, simplifying link choices, and using personalisation based on behaviour and preferences.
- Driving more ordersStrategies such as high-intent triggers, tailored product recommendations, social proof, and streamlined paths from email to checkout help lift placed order rates.
Wondering how you stack up in your customers’ inboxes in 2026? You’re definitely not alone.
The problem is, most of us only see our own numbers. Without any context, it’s hard to know whether your results are genuinely strong, or just fine.
Are your open rates on par with other fashion brands? Do your emails get fewer or more clicks than your fellow beauty brands? And are your placed order rates looking as healthy as the food and beverage brand next door?
All fair questions. And they’re almost impossible to answer without access to everyone else’s dashboards.
Good news: we’ve done the heavy lifting for you. Klaviyo analysed data from over 183,000 brands to bring you the 2026 benchmarks for:
- Email marketing open rates
- Email marketing click rates
- Email marketing placed order rates
Use these email marketing benchmarks as your compass. They’ll help you understand where you’re outperforming, where there’s room to grow, and where small improvements can make a big difference.
Email marketing open rate benchmarks by industry
Why do email marketing open rates matter?
Getting people to open your emails is the first hurdle. If they don’t, then everything else is irrelevant because shoppers won’t get to see your exclusive discount, abandoned cart reminder, or personable welcome email.
The more people open your emails, the higher your knock-on stats like click rates and conversion rates. Paying attention to open rates can also help you figure out which subject lines are most effective.
Disclaimer: Open rate isn’t 100% effective because Apple “opens” each email for any user with an enabled Apple MPP, whether or not they actually open the email. But it can still be a good directional metric.
Email marketing open rate benchmarks
We’re going to split these benchmarks into two categories:
- Email campaigns: one-off emails sent to a specific marketing list, typically used to promote launches, seasonal events, sales, announcements, or broader marketing initiatives.
- Automated flows: behaviour-triggered email sequences that run continuously in the background, typically used to guide shoppers through key moments in their journey, like welcoming new subscribers, recovering abandoned carts, nurturing leads, driving repeat purchases, or re-engaging inactive customers.
This division is important because each type of email plays a different strategic role: campaigns are designed to drive timely, collective action around a specific initiative, while flows are built to respond to individual customer journeys and convert high-intent moments over time.
Campaign email open rate benchmarks
The average email campaign open rate across all industries is 31%, with the top 10% of performers hitting a 45.1% open rate.
Let’s break down average email campaign open rate by industry:
Industry | Average open rate |
Clothing & accessories | 33.1% |
Automotive | 29.4% |
Electronics | 29.3% |
Food & beverage | 31.2% |
Hardware & home improvement | 30.9% |
Health & beauty | 30.5% |
Home & garden | 32.5% |
Jewellery | 32.5% |
Mass merchant | 28.7% |
Office supplies | 28.9% |
Specialty | 32% |
Sporting goods | 31.9% |
Toys & hobbies | 31.7% |
How to improve your email marketing open rates
- Craft compelling subject lines that pique curiosity, convey value, and establish common ground with subscribers.
- Personalise subject lines and preview text by incorporating the recipient’s name, location, or a reference to an action they recently took.
- A/B test different subject lines to see what resonates most, and experiment with tone, length, urgency, and personalisation.
- Keep your subject lines short and sweet, and get straight to the point. Make sure they’re fully visible on mobile devices.
- Use emojis sparingly to keep your subject lines uncluttered and readable on mobile.
Email marketing click rate benchmarks by industry
Why do email marketing click rates matter?
Click rate shows the percentage of recipients who click on a link in your email. The click rate is a strong indicator of whether your messaging, offer, and call-to-action resonate with your audience. It also reflects buying intent. Shoppers need to visit your website before they can make a purchase, and clicking is the critical step that moves them from inbox to storefront.
Email marketing click rate benchmarks
Campaign email click rate benchmarks
The average email campaign click rate across all industries is 1.69%, with the top 10% of performers hitting a 3.38% click rate.
Let’s break down average email campaign click rate by industry:
Industry | Average click rate |
Clothing & accessories | 1.83% |
Automotive | 1.83% |
Electronics | 1.85% |
Food & beverage | 1.7% |
Hardware & home improvement | 1.84% |
Health & beauty | 1.24% |
Home & garden | 1.78% |
Jewellery | 1.6% |
Mass merchant | 1.77% |
Office supplies | 1.88% |
Specialty | 1.65% |
Sporting goods | 1.88% |
Toys & hobbies | 2.03% |
Automated email click rate benchmarks
The average automated email flow click rate across all industries is 5.58%, with the top 10% of performers reaching 10.48%.
Let’s break down average email flow click rate by industry:
Industry | Average click rate |
Clothing & accessories | 5.54% |
Automotive | 5.45% |
Electronics | 6.11% |
Food & beverage | 5.8% |
Hardware & home improvement | 5.65% |
Health & beauty | 4.8% |
Home & garden | 5.96% |
Jewellery | 5.42% |
Mass merchant | 5.55% |
Office supplies | 5.81% |
Specialty | 5.47% |
Sporting goods | 6.13% |
Toys & hobbies | 5.96% |
How to improve your email marketing click rates
- Make your primary call-to-action visually stand out (use a button, not just hyperlinked text), place it high enough in the email that readers don’t have to hunt for it, and use benefit-driven language (e.g., “Shop the new collection,” or “Get 20% off today”.
- Test subject lines, preview text, offer types (percentage vs. pound discount), CTA wording, button placement, imagery, email length, and even send time.
- Link to products or categories aligned with each shopper’s interests. For example, show men’s trainers to someone who browsed men’s footwear or recommend refills for a product they previously purchased.
- Avoid adding too many links to your emails and causing choice overload.
- Use data like past purchases, browsing behaviour, loyalty status, or lifecycle stage. For example, send a replenishment reminder to repeat buyers or a “complete the look” recommendation to recent purchasers.
Email marketing placed order rate benchmarks by industry
Why do email placed order rates matter?
Placed orders equal sales. Higher placed order rates mean more customers and more revenue, which means your email marketing strategy is working.
Email marketing placed order rate benchmarks
Campaign email placed order rate benchmarks
The average email campaign placed order rate across all industries is 0.16%, with the top 10% of performers hitting a 0.36% placed order rate.
Let’s break down average email marketing placed order rates by industry:
Industry | Average placed order rate |
Clothing & accessories | 0.12% |
Automotive | 0.11% |
Electronics | 0.09% |
Food & beverage | 0.26% |
Hardware & home improvement | 0.11% |
Health & beauty | 0.19% |
Home & garden | 0.13% |
Jewellery | 0.08% |
Mass merchant | 0.14% |
Office supplies | 0.14% |
Specialty | 0.18% |
Sporting goods | 0.11% |
Toys & hobbies | 0.19% |
Automated email placed rate benchmarks
The average automated email flow placed order rate across all industries is 2.11%, with the top 10% of performers reaching 4.3%.
Let’s break down email flow placed order rate by industry:
Industry | Average placed order rate |
Clothing & accessories | 2.15% |
Automotive | 1.94% |
Electronics | 1.95% |
Food & beverage | 2.46% |
Hardware & home improvement | 2.07% |
Health & beauty | 1.96% |
Home & garden | 2.12% |
Jewellery | 1.85% |
Mass merchant | 1.95% |
Office supplies | 2.18% |
Specialty | 2.06% |
Sporting goods | 2.13% |
Toys & hobbies | 2.14% |
How to improve your email marketing placed order rates
- Ask for preferences like product category, size, or shopping intent at sign-up, then use that information to send highly relevant product recommendations, replenishment reminders, or tailored offers.
- Include contextual customer reviews and user-generated content to add social proof and get customers over the line.
- Use high-intent triggers like abandoned carts, browse abandonment, and welcome series tailored to early purchase decisions.
- Make it easier for subscribers to complete an order once they’re engaged with fewer clicks from email to checkout (e.g., direct “add to cart” buttons or pre-filled cart links).
Make sure every link sends people to a place where they can complete a purchase (like a specific product, category, or cart page) rather than a homepage.
Key takeaways from these email marketing benchmarks
Email marketing benchmarks vary from industry to industry, and bear in mind that these are just averages.
Some brands achieve far higher open rates, click rates, and placed order rates than these, while others struggle to meet the minimum. It all depends on what strategies you use and how granular you get with your segmentation.
Here’s a breakdown of the key findings from the latest benchmark figures:
- Automated flows consistently outperform campaign emails in all areas (open rates, click rates, and placed order rates).
- Flow-based emails deliver 3x higher click rates (5.58% vs. 1.69%) and 13x higher placed order rates than campaigns.
- Top performers achieve up to double the average opens, clicks, and placed order rates.
- Open rates, click rates, and placed order rates can vary by up to 2% depending on the industry, but most fall into a similar bracket.
- Email flows generated nearly 41% of email revenue from just 5.3% of sends in 2026.
Core strategies to optimise your email marketing in 2026
Klaviyo’s 2026 Omnichannel Benchmark Report reveals average open rates, click rates, and placed order rates across key marketing channels, including email and SMS. You’ll see performance benchmarks for different types of email flows and campaigns, such as abandoned cart, post-purchase, and welcome series alongside insights into how SMS performs across similar moments in the customer journey.
Want to know what your welcome email open rates should look like? Or whether your abandoned cart conversions could be stronger? We’ve compiled cold, hard data from B2C brands’ marketing dashboards to show you exactly what top performers are achieving this year. Think of it as something to aspire to—or, if you’re already smashing your goals, a celebratory read.
You’ll also get insider advice from high-performing brands on the proven, cross-channel strategies they use to improve engagement and revenue across their entire customer communication mix.
See how your brand stacks up. Get the benchmarks.

Related content