15 Customer-First Data™ points to inform & improve your marketing efforts right now


The internet gives us unparalleled insight into consumer behavior…
…especially when it comes to our own websites and our owned marketing channels. But not everything is worth paying attention to.
Worse, focusing on the wrong data points can spell long-term disaster for your brand.
“The biggest flaw with companies that launch nowadays is that the focus shifts from, ‘We need to focus on education and building brand,’ to ‘We need to acquire x number of users in a short period of time,’” direct-to-consumer (DTC) expert Nik Sharma said in a video posted on Twitter.
“It just becomes a game of, ‘How well can we trick this person into becoming a customer,’ versus ‘How much can we push education so that it’s still their decision?’ That to me is always a big red flag.”
The biggest flaw with companies that launch nowadays is that the focus shifts from, ‘We need to focus on education and building brand,’ to ‘We need to acquire x number of users in a short period of time.
Sharma’s point is that when you focus only on acquisition through advertising, you end up far too reliant on that channel to drive revenue. Instead, brands should work on building strong customer relationships that can drive revenue outside of third-party platforms––and they should start focusing on that as early as possible, even in their advertising itself.
Focusing on and optimizing the wrong data points leads to this over-reliance on advertising and third-party platforms.
But, what are the right data points for brands to focus on anyway? Which data points help brands build a Customer-First Marketing organization in which customer relationships are priority #1?
To answer those questions, we need to understand the different types of data that exist on the internet, and the larger privacy-first trends that will define the next era of the web.
The 4 types of consumer data classifications
There are four types of data that can be collected on the internet:
1. Zero-party data
Zero-party data accounts for the information that people voluntarily offer to brands, like their email address or phone number.
2. First-party data
First-party data accounts for information observed by a brand about someone on their owned properties, where consent is collected.
3. Second-party data
Second-party data is information shared with your brand through a partner––data the individual did not necessarily agree for your brand to access or use.
Online sweepstakes are a good example of second-party data. In this case, someone signs up for a sweepstakes, and then gets unsolicited emails from unrelated companies. This happens when folks entering that sweepstakes agree to the terms & conditions, which often acknowledge that the company can give or sell their email to outside organizations. This use of an individual’s data is second-party.
4. Third-party data
Third-party data is personal information offered to brands for use primarily in targeted advertising. This is what allowed Facebook ad targeting to be so precise—and profitable.
Using third-party cookies, the Facebook pixel collected not just behavior and data points about people on Facebook, but also around the web. Consumers typically do not know—or have not explicitly agreed to—this third-party use of data by brands.

The rise of Customer-First Data and optimizing for the customer experience
Customer-First Data is ethically collected data, or data collected with the knowledge, permission and explicit consent of your prospects and customers.
This includes only first and zero-party data.

The use of this data—and only this data—by brands to market and advertise is a consumer-led movement. This consumer privacy movement is driven by a better understanding of data collection practices on the internet.
Even big tech organizations like Apple have implemented data privacy changes that allow consumers to have more control over what they share with brands.
These changes are seismic––and they put the performance marketing and advertising playbook of the last decade into jeopardy.
But brands that collect Customer-First Data and use that information to improve brand experiences are finding success—all without ever having to rely on Facebook or other third-parties.
Just ask brands that sell CBD products or other “taboo” items. Those companies have long been banned from Facebook advertising, instead using Customer-First Data optimizations for long-term growth.
Check out House of Wise, for instance.
The company sells CBD products, and therefore couldn’t use the typical Facebook advertising playbook implemented by most ecommerce startups. Instead, founder Amanda Goetz leaned heavily into the CBD wellness community, building a “wise woman” affiliate program to connect with her audience. She then shared the highs and lows of her founder journey on Twitter, growing a large, loyal audience of current and future customers.
Goetz’s efforts recently resulted in organic coverage from the Kardashians:
It wasn’t all just Goetz’s efforts, though. House of Wise wisely used Customer-First Marketing to build community and better position the company in a crowded and competitive space.
So, you’re in! You want to start building a Customer-First Marketing organization, but you have questions.
- What customer-first data can you collect?
- Where do you find it?
- And how will it help build your business?
Let’s dive in!
Browsing behaviors: 5 key data points to illuminate intent
This type of behavioral data is what you will typically get from Google Analytics on an anonymized basis. Be sure you collect consent on your website so that consumers are aware of and agree to this data collection, even if on an anonymized basis.
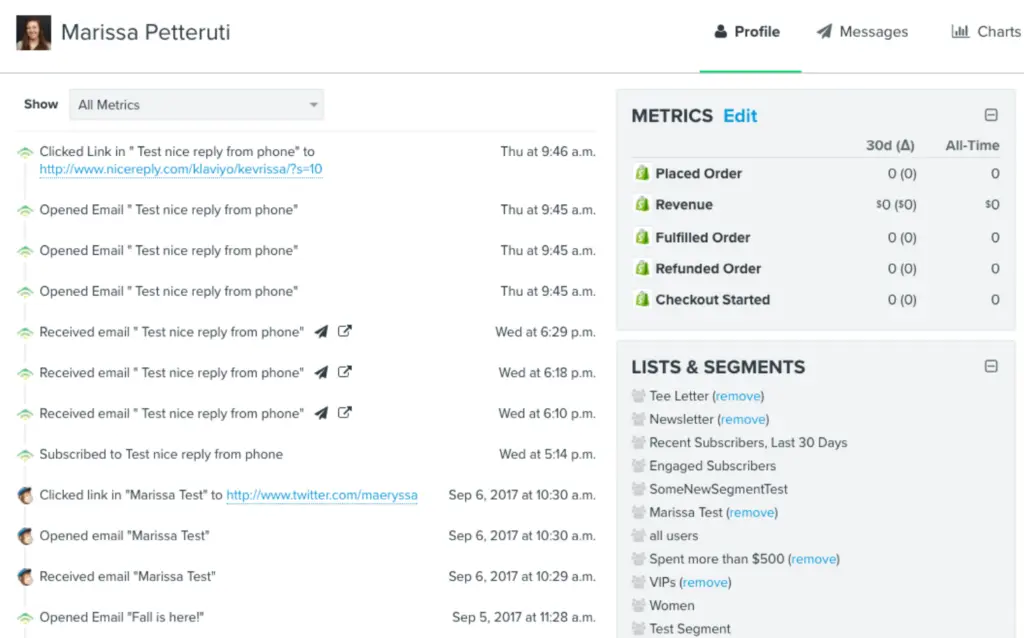
Once someone gives you their email via checkout or signing up for your newsletter, you can start to see their individualized site behavior in tools like Klaviyo or Shopify.
Here is what to look for:
Traffic flow
Typically measured in sessions or visits, traffic flow is defined as the ways in which your prospects or customers find your site, and then move through it. This data can be found in Google Analytics.

Questions to ask with this data:
- Are visitors moving fluidly from one page to the next—or, are they bouncing?
- Are there specific channels driving more traffic than others? Are those visitors converting better or worse than other segments?
- Are there a lot of repeat visitors—or, is it mostly new visitors? What can be done to increase the amount of repeat traffic?
- Are most visitors from mobile devices or desktop? Is the experience designed well for both of those interfaces? Are there similar or different sticking points that should be addressed based on the device?
Average time spent on your site
Uncovering the average time your customer spends on a page of your site can help you spot bots (hint: they don’t stay for very long!). It can also help to identify pages that are not resonating with your target audience.

Does it necessarily mean you need to alter the page? No—you might just need to target a different set of consumers.
A lot of great marketing starts by using this data to learn how effective you are—or aren’t—and can help you to make appropriate changes to your site.
Keep in mind that the longer someone stays on your site, the more engaged they likely are with your brand. Blog posts, videos, and customer reviews are only some of the ways you can increase visitors’ time on your site.
Questions to ask with this data:
- How long are customers staying on different pages of your site?
- Are they staying on specific pages for longer periods? Which ones?
- Can you copy that format across your other pages?
Exit page
Keeping track of the page where your visitors exit (the final page visited before clicking off the site) can help you identify pages that perform poorly. This can also be seen through your bounce rate.

For example, does one page in particular have a high exit or bounce rate? Do visitors quickly leave the site? It might be worth reviewing that page to see what you can do to improve the user experience.
Questions to ask with this data:
- Do any pages have a higher than average exit or bounce rate? Explore what might be causing that.
- Are there pages that have a lower than average exit or bounce rate?
- What can be learned from those pages—and how can you apply those lessons to improve exit or bounce rates on lower performing pages?
Browse abandonment
If users are getting stuck—or not converting—on specific product pages, this is called browse abandonment. Despite the negative connotation of “abandonment,” it isn’t always a bad thing.

Insights from Google show that 53% of consumers prefer to research a product before making a purchase. So, these folks may simply be contemplating a decision before returning to the site to check out and complete the purchase.
Still, it is a good idea to pay attention to the items where this frequently happens. This can help you set a baseline for average browse abandonment. Over time, a pattern will develop and you’ll notice when there’s an elevated abandonment with certain products––and be ready to take action.
Questions to ask with this data:
- Are there specific pages with a higher than average browse abandonment?
- What information can I add to poorer performing product pages to reduce browse abandonment?
- Is there anything to be learned from product pages with lower levels of browse abandonment that I can apply to other pages?
- Do promotional activities seem to have any effect? For example, do emails improve or hurt browse abandonment? What about text messages?
Browse Abandonment Tip:
Cart abandonment
Similar to browse abandonment, cart abandonment is when someone puts a product or products in their cart—but doesn’t check out.

Again, this may or may not be a bad thing. Many consumers add items to their cart without purchasing as an alternative to a “wishlist.” Others may do it to see if you’ll send them a discount code. Yeah, consumers are pretty savvy.
You’ll want to monitor which products are most often left in abandoned carts. This way, you can establish a baseline and then gain an understanding as to why some products have a higher abandoned cart rate.
Questions to ask with this data:
- Are the products priced too high?
- Are the products with low review counts—or with lower star ratings—abandoned more often?
- Are you using any urgency on your product pages? This can include alerts about stock updates, countdowns to sales, great customer reviews, and more.
- What can you do to make your abandoned cart products more attractive?
Cart abandonment tip:
Send a cart abandonment email to remind visitors of the items they left behind—and motivate them to return to the site and complete their purchase. “We seek to provide customers with additional information on the product [when sending an abandoned cart email],” explains Jordan Elist, founder of mate, a men’s sexual wellness brand. “That way, they’re making an informed decision and are assured that this is the right product for them.”
Buying behavior: 5 cardinal data points to monitor engagement
Buying behavior is some of the most important data you can collect and mine to segment your customers. Use this data to learn more about the kinds of products your target audience loves—and more.
Here are five key buying behaviors:
Purchase history
You can find purchase history data in Klaviyo, your ecommerce platform of choice—and even in your third-party logistics provider’s (3PL) backend. Just about everyone measures this important customer data––and so should you.
Take notice of the types of items your customers purchase, and how much money they spend.
A customer’s purchase history helps predict the kinds of products they are most likely to buy in the future. It also informs which products to include in your future, personalized marketing.
For example, bargain-conscious customers who tend to shop sales will likely be receptive to promotional messaging featuring special deals and offers. With this information, you can put those folks in a specific sales segment and ensure that all promotions for sales will go directly to their inbox.
Questions to ask with this data:
- Do these customers usually spend a lot?
- Do they purchase many items at once—or, do they only buy a single thing at a time?
- Do they splurge on high-value items—or, do they go after sales?
- How can you segment your lists to target buying behaviors and encourage more sales based on how folks like to shop?
Purchase frequency
Similar to purchase history, you can find this data in Klaviyo—and just about any other system that is processing your customer’s purchase, including your ecommerce platform provider and your 3PL.
With purchase frequency, you can observe how often your customers buy from you to predict when their next purchase will be.
Patterns in purchase frequency can help you hone future messaging and suggest other products they may be interested in.
Questions to ask with this data:
- When was the last time these customers bought something from you?
- How often do they purchase from your online store?
- Are they buying similar or unrelated products over time?
Predictive analytics to the rescue
Purchase history and frequency contribute to your customer lifetime value. Analytics tools in platforms like Klaviyo can help you predict the longevity (or lifetime) of a customer with your brand, based on their engagements. This includes their purchase behavior.
Time since last visit
Both Klaviyo or your ecommerce platform offer this customer data in several places, or you can calculate it yourself based on purchase history and other customer engagement factors.

This data point shows the length of time since a customer last visited your site. It can also help you gauge the level of your customers’ engagement.
Customers are generally considered inactive if they haven’t interacted with your site for six months or longer.
Questions to ask with this data:
- How can you reconnect with customers who have been out of the loop? Have you tried email or text messaging to reconnect with them?
- If you are using email or text messaging to reactivate customers, are you getting a response? Do you need to update messaging? Try A/B test timing and changing the copy.
- Are there any noticeable trends based on last engagement or the time of the last visit? If so, this is a great segway into cohort-marketing as your business grows.
Winback email tip:
Encourage customers into doing business with you again by sending an email featuring a new product launch. You can also try sending a winback email to rekindle the bond.
Average order value
You can easily find this information in Klaviyo, your ecommerce platform of choice, or other analytics tools.
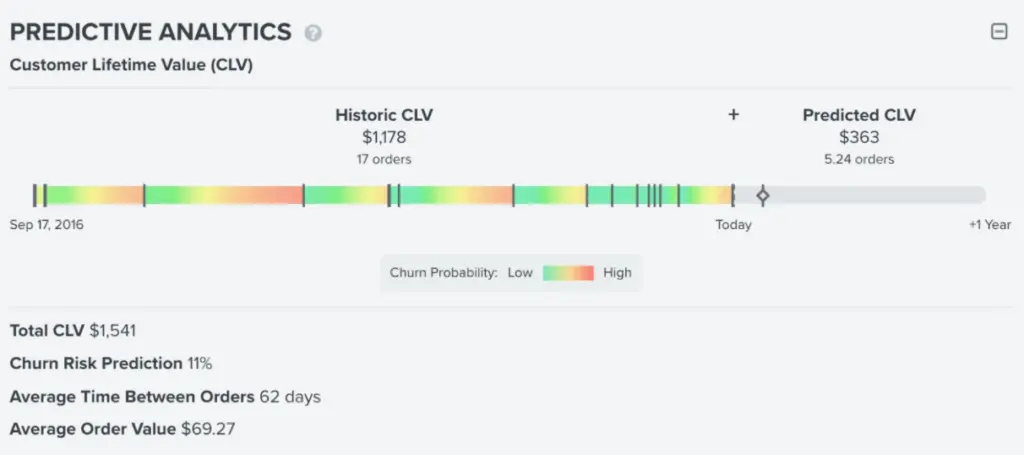
Average order value is another one of the very important inputs into customer lifetime value. This helps you understand how much revenue an individual has generated compared with what you spent to get them to buy initially.
Knowing the average order value also helps you determine an effective pricing strategy, among many other things (like, is your business going to be profitable? Very important!).
Questions to ask with this data:
- What is the average amount customers spend on orders?
- What can you do to increase that amount? Are there things you can offer as an incentive, like free shipping?
- If you can’t increase average order value on a single purchase, are there things you can do to segment customers? Try increasing your repeat purchase rate via personalized emails or text messages.
Subscription activity
This information can be found easily in Klaviyo, or your email marketing platform.

Subscription activity allows you to take notice when a customer subscribes or unsubscribes from your messaging campaigns. If a customer unsubscribes, it may indicate that they no longer find value in your messaging or offerings.
If this subscriber has already produced a high customer lifetime value for you, maybe that’s ok. Not every single customer is going to buy from you forever. And you don’t need them to.
But if you notice that a large portion of your audience is unsubscribing early in their lifetime with your organization, for example, you probably need to do a better job of explaining who you are as a brand. A welcome series is the perfect place for this.
Questions to ask with this data:
- Are there emails or text messages that have high unsubscribe rates? If so, can you update the messaging, the targeting, or even the timing to reduce unsubscribes?
- Is there a baseline you can set for how long someone stays active with your brand via email or text messages before they unsubscribe? How can you improve that length of time?
Email and text behavior: 2 data points to benchmark all campaigns against
Don’t confine collecting first-party data to the digital edges of your website. How your audience interacts with your owned channels—like email and SMS—is a gold mine, and it’s a great way to collect zero-party data, too.
Here are some helpful actions:
Message engagement
Run a custom report in Klaviyo (or the email or SMS tool of your choice) to quickly determine what kinds of messages are performing well—and where you’re not hitting the mark.

Throughout the customer journey, you’re sending a variety of emails and texts to your audience, each designed with a specific purpose or theme.
- Sometimes your messages are promotional, like announcing a flash sale or holiday discount.
- Other times they may be transactional, like notifying a customer that their order has shipped or is out for delivery.
- Your message could be strictly for educational purposes, like marketing automations that teach a customer how to set up your product, or detail specific cleaning instructions.
Based on your audience or product, some messages may have higher levels of engagement than others. When you determine the kinds of emails or texts that engage your audience, you can spend more time on creating and perfecting valuable content.
Questions to ask with this data:
- What kind of messages are receiving the most engagement?
- Do some messages perform better as a text message than as an email? And vice versa?
- Are there patterns in performance? Do certain messages—like promotional, transactional, and educational—perform well during specific months of the year?
Link activity
For any email or text message that you send in Klaviyo, you can get a visual breakdown of what links are being clicked on by users.

Link activity—or, the items your subscribers are clicking on in your emails and text messages—helps you determine the effectiveness of your content and desired call-to-action (CTA).
For example, if you send a weekly newsletter and find that the stories near the bottom consistently receive few to no clicks, it could indicate that you’re sharing too much information at once. Subscribers may simply lose interest the more they have to scroll.
Or perhaps you notice that when your CTA for a promotional message is in the middle of the body copy, it receives more clicks than when it’s at the bottom. The more link activity data that you keep track of, the easier it’ll be to make design decisions in the future.
Questions to ask with this data:
- Which links receive the most clicks?
- Where are those links located in the email or text?
- What could cause someone not to click? Maybe the link or button is hard to see—or, maybe there’s too many buttons. Do your subscribers have to scroll through endlessly? Is the CTA unclear or confusing?
Gather data through A/B testing:
A/B tests will help you understand your subscribers’ preferences. But beware—if you test too many components of your emails or texts at once, you won’t know what’s affecting performance. Instead, always test one variable at a time. Try sending two identical emails, but with different placements of the CTA. This way, you can easily determine which version performs better.
Customer preferences: 3 ways to collect the all important zero-party
Zero-party data, when used in combination with first-party data, helps you get a better understanding of your customers. This includes learning more personal details about your customers, like the products they love—and the ones they don’t.
First-time visitors to your website, customers who have placed an order, and those who sign up for your email or SMS lists are all prospects who can reveal data about their preferences.
Here are a few ways to ask for that customer information:
Signup forms
In Klaviyo, the data that you collect from signup forms lives in a user’s profile, so you can easily access it to build segments.

Signup forms are popups, flyouts, or embedded forms that exist on certain pages of your website. You can customize the copy on these forms so they’re relevant to the person who views them.
The core information that signup forms typically collect are email addresses, phone numbers, and first and last names.
But depending on your brand, it might make sense to ask for additional data. Try asking for a visitor’s favorite color, dream destination, or birthday. Then, use these data-points to create personalized experiences for these visitors on your website, in emails, and in text messages. This way, you’re building a community with your audience.
Questions to ask with this data:
- Does a visitor prefer to receive their communications via email or text?
- Are they shopping for themselves, or for someone else?
- Did they provide some of the information asked for—but not all? Is this a common user experience? Can you uncover a reason why folks aren’t providing all the information you ask for? Do you need all that information?
- What can be done with this data to improve my customer’s experience with the brand?
- Is there a way to use this data to build more loyalty or improve customer retention—and help to solve problems for my customer?
Quizzes or surveys
Quizzes and surveys can help you learn what kinds of products interest your visitors.
In Klaviyo, you can collect zero-party data from onsite quizzes or surveys via an integration with software like Octane AI, Typeform, and Jebbit.

How might you use this information? Consider this: Your product inventory may consist of more than 30 items, but a visitor may only be interested in two specific products. The zero-party data that you collect from quizzes and surveys helps you weed out the items that are irrelevant to some visitors—but are the golden ticket for others.
Hair-care brands shine (pun intended) in this arena.
There is a wide variety of hair types. Genetics, climate, physical activities, or how frequently one washes their hair—all of these things can dictate what kind of hair solutions someone may be searching for. A hair survey that asks specific lifestyle questions can help brands offer more personalized recommendations.

Questions to ask with this data:
- Are people completing the entire quiz or survey?
- If they’re abandoning the quiz or survey, which questions caused them to leave?
- How can I use the collected data to create immediate on-site personalization or recommendations?
- How can I use this data over time to inform my marketing strategy and create a better brand experience for my customers?
Post-purchase automations
Information collected from post-purchase automations is stored directly in Klaviyo.

These email automations are messages sent after someone has purchased one of your products. They’re usually sent at least one month after a customer has received an order. This way, it gives them enough time to use what they purchased.
You can request feedback from your customers. Ask them to rate your product, or write a review.
Not only can you use this information to potentially improve your products, but you can also make recommendations based on items they loved. You can also use user-generated content and positive reviews in future marketing campaigns.
Questions to ask with this data:
- What did customers like? What did they dislike?
- Are certain products receiving poor reviews? Can you improve this product experience, and quickly?
- Where can you use this information to encourage others to make a purchase?
- How can you use this data to recommend more products to these customers, or how can you personalize their experience with your brand in an authentic way?
Building exceptional marketing experiences with Customer-First Data at the core
You have a near-endless amount of data available to you about your audience. As a marketer or founder, it can be an overwhelming task to try and pinpoint what, exactly, is the right data to watch.
Customer-First Data––the combination of zero- and first-party data––sets your organization up to ethically collect data on your customers that you can use to improve their brand experiences and build better relationships.
This data also helps you identify the right metrics to measure so that you don’t become overly reliant on performance marketing.
On the path to Customer-First Marketing that puts the customer at the center of all brand activities, Customer-First Data helps spot issues, measure performance, and ultimately provide what your loyal customers seek: an always improving experience with one of their favorite brands.
Want to learn more about Customer-First Data and where it fits into the dawn of a privacy-first world? Read the full guide.


